
Voltage Current Characteristics of Insulated Gate Bipolar Transistor (IGBT)
Output Characteristics of Insulated Gate Bipolar Transistor (IGBT)
STEP 1: Drag and drop the components in the workspace to create the circuit.
Nos of required components:
DC Source – 2, IGBT – 1, Resistor - 2, Voltmeter - 2,
Ammeter - 1, Ground - 1
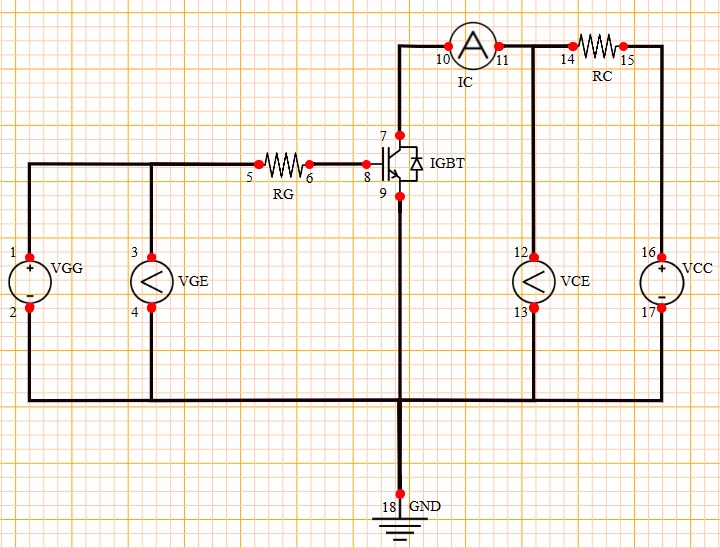
STEP 2: Make the connections as per the instructions given below:
(a) (01-05, 03-05, 06-08, 02-18)
(b) (04-18, 09-18, 07-10, 11-14)
(c) (14-12, 13-18, 15-16, 17-18)
Note: Click on the wire to delete the connection.
STEP 3: Click on the CHECK button to check the connections.
Note: Right click on the component to open the dialog box to edit the properties of the component.
STEP 4: Select the value from VGG.
STEP 5: Now, Select the value from VCC and click on the ADD button to insert the reading into the observation table.
STEP 6: Change the values in VCC by repeating Step 5 upto 7 V, then the Graph will plot automatically.
STEP 7: Now, Change the value in VGG and repeat Step 5 to 6 to take more readings in the table.
STEP 8: Click on Transfer Characteristics button to plot the transfer characteristics.
STEP 9: Click on the PRINT button to take out the print of the webpage.
STEP 10: Click on the RESET button to reload the webpage.
Nos of required components:
DC Source – 2, IGBT – 1, Resistor - 2, Voltmeter - 2,
Ammeter - 1, Ground - 1
STEP 2: Make the connections as per the instructions given below:
(a) (01-05, 03-05, 06-08, 02-18)
(b) (04-18, 09-18, 07-10, 11-14)
(c) (14-12, 13-18, 15-16, 17-18)
Note: Click on the wire to delete the connection.
STEP 3: Click on the CHECK button to check the connections.
Note: Right click on the component to open the dialog box to edit the properties of the component.
STEP 4: Select the value from VGG.
STEP 5: Now, Select the value from VCC and click on the ADD button to insert the reading into the observation table.
STEP 6: Change the values in VCC by repeating Step 5 upto 7 V, then the Graph will plot automatically.
STEP 7: Now, Change the value in VGG and repeat Step 5 to 6 to take more readings in the table.
STEP 8: Click on Transfer Characteristics button to plot the transfer characteristics.
STEP 9: Click on the PRINT button to take out the print of the webpage.
STEP 10: Click on the RESET button to reload the webpage.
Transfer Characteristics of Insulated Gate Bipolar Transistor (IGBT)
STEP 1: Drag and drop the components in the workspace to create the circuit.
Nos of required components:
DC Source – 2, IGBT – 1, Resistor - 2, Voltmeter - 2,
Ammeter - 1, Ground - 1
STEP 2: Make the connections as per the instructions given below:
(a) (01-05, 03-05, 06-08, 02-18)
(b) (04-18, 09-18, 07-10, 11-14)
(c) (14-12, 13-18, 15-16, 17-18)
Note: Click on the wire to delete the connection.
STEP 3: Click on the CHECK button to check the connections.
Note: Right click on the component to open the dialog box to edit the properties of the component.
STEP 4: Select the value from VCC.
STEP 5: Now, Select the value from VGG and click on the ADD button to insert the reading into the observation table.
STEP 6: Change the values in VGG by repeating Step 5 upto 6 V, then the Graph will plot automatically.
STEP 7: Click on the PRINT button to take out the print of the webpage.
STEP 8: Click on the RESET button to reload the webpage.