
X-Ray Fluoresce microscopy for determination of chemical composition of materials
X-ray Fluorescence (XRF) is a non-destructive analytical technique used for the qualitative and quantitative determination of elemental composition in materials such as metals, alloys, ceramics, and powders. The technique is based on the emission of characteristic secondary (fluorescent) X-rays from a material that has been excited by high-energy primary X-rays.
When a material is irradiated with high-energy X-ray photons from an X-ray tube, atoms in the sample absorb the incident energy. If the energy of the incoming photon exceeds the binding energy of an inner-shell electron (K or L shell), that electron is ejected from the atom. This process creates a vacancy in the inner shell and leaves the atom in an excited, unstable state. As illustrated in Fig. 1, the atom returns to a lower energy state when an electron from a higher energy shell (L or M shell) fills the vacancy. During this transition, the energy difference between the two shells is released in the form of a characteristic X-ray photon.
The emitted X-rays have discrete energies that are unique to each element. These are called characteristic X-rays.
Two common transitions are:
• Kα radiation: Produced when an electron from the L-shell fills a vacancy in the K-shell.
• Kβ radiation: Produced when an electron from the M-shell fills a vacancy in the K-shell.
Because each element has unique energy differences between its electron shells, the emitted X-ray energies act as a fingerprint for elemental identification. This forms the basis of qualitative analysis in XRF. The energy of emitted radiation depends on the atomic number (Z) of the element, following Moseley’s Law [1][2][3].
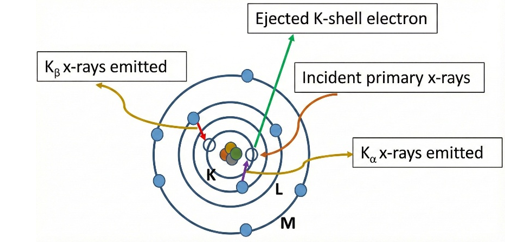
Fig. 1: Generation of secondary x-rays from primary source
The major components of XRF are:
- X-ray Tube – Generates primary X-rays.
- Sample Holder – Holds the specimen to be analyzed
- Collimator – Produces a parallel beam of emitted X-rays.
- Analyzing Crystal – Disperses X-rays based on wavelength.
- Detector – Measures diffracted X-rays.
- Data Processing System – Converts signals into intensity vs angle spectrum.
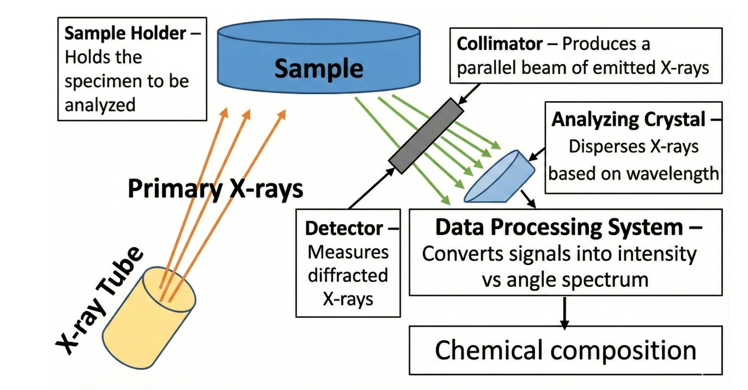
Fig. 2: Schematic of XRF instrument and their components
Bragg’s Law and Wavelength Separation:
The emitted characteristic X-rays are directed onto an analyzing crystal. The crystal diffracts X-rays according to Bragg’s Law:
nλ = 2 d sinθ
Where:
n = order of diffraction
λ = wavelength of characteristic X-ray
d = interplanar spacing of the analyzing crystal
θ = Bragg angle
Only X-rays satisfying this condition will be constructively diffracted and detected.
By rotating the crystal and detector through different angles (2θ), different wavelengths are sequentially detected. Thus, the position of the peak in terms of 2θ corresponds to a specific element.
Different analyzing crystals (LiF, Ge, PE, TIAP) are used to cover different wavelength ranges as shown in Table 1.
Qualitative and Quantitative Analysis:
Qualitative Analysis
The identification of elements is based on the position of peaks in the XRF spectrum. Each element produces characteristic peaks at specific wavelengths (or corresponding 2θ angles). By comparing peak positions with reference standards, the elements present in the sample can be identified.
Quantitative Analysis
The intensity (height or area) of each characteristic peak is proportional to the concentration of that element in the sample:
Intensity ∝ Concentration
After calibration with standard reference materials, the concentration of elements can be determined accurately from ppm levels to high weight percentages.
XRF Spectrum Interpretation:
A typical XRF spectrum plot shown in Fig. 3
• X-axis: 2θ (degree) or wavelength
• Y-axis: Intensity (kcps - kilo counts per second)
Each sharp peak corresponds to characteristic radiation from a specific element (e.g., Fe Kα, Cr Kα, Ti Kα). The peak position indicates the element (qualitative analysis), while peak intensity indicates its amount (quantitative analysis). Background radiation arises due to scattering effects such as Compton and Rayleigh scattering.
Table 1: List of crystals used for detection of wide variety of materials (metals, alloys and ceramics)
| Crystals used for analysing crystal | Energy of X-rays |
|---|---|
| LiF (Lithium fluoride) | Very short to medium energy (nickel, copper, Zinc) |
| Ge (Germanium) | For Higher energy x-rays (titanium, vanadium etc.) |
| PE (Pentaerythritol) | For medium energy x-rays (chlorine, sulphur, phosphorus) |
| TIAP (Thallium acid phthalate) | For light energy x-rays (oxygen, carbon, nitrogen) |
| Crystal Fluorescence | For background noises |
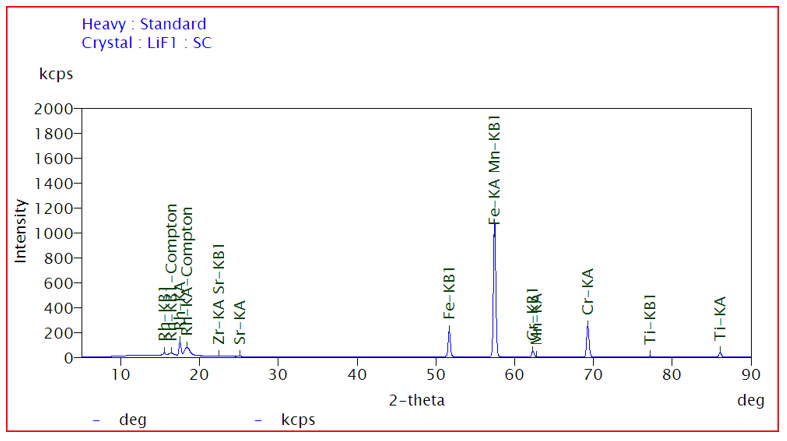
Fig. 3: Elemental mapping of sample (intensity vs energy)