To Study the Wien Robinson's frequency Bridge 
Procedure

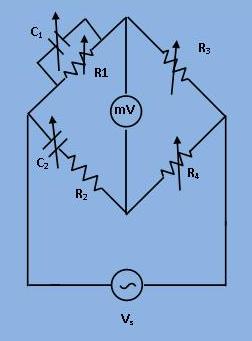
Fig. 1. Circuit digram of experimental set-up for frequency measurement by Wien Robinsons Bridge.
$$ R_4 = 2 * R_3 (say R_3=1000 \omega) $$
Set the dial of the signal generator to read 500 Hz. Apply the signal generator voltage to the bridge. Keep
$$ C_1 = C_2 = 0.1 \mu F $$
and adjust resistance R4 and R3 together such that they always read the same value and at balance note the component values and calculate the frequency by
$$ F_c = \frac{1}{2 \pi RC} where\ $$
$$ R = R_1 = R_2 and\ $$
$$ C = C_1 = C_2\ $$
The percentage error between stimulated bridge frequency (Fd) and the (voltage) source frequency (Fs) is calculated with respect to Fd as
$$ \%Error = \frac {(F_d - F_c) * 100} {F_d} $$
where Fd is also called the dial frequency. Repeat procedure for various dial frequencies.
#2 Set the values of the components to give balance of a setting of 1000 Hz. Note the reading of the detector for different dial frequencies on either side in small steps, keeping the output amplitude of the signal generator constant. Draw a graph showing the relation between the unbalanced voltage vs. dial frequency.
