
Mean and Covariance
1. Calculate the mean of the following data. 0.9501, 0.2311, 0.6068, 0.4860, 0.8913, 0.7621, 0.4565, 0.0185, 0.8214, 0.4447
2. What is the variance of the above data?
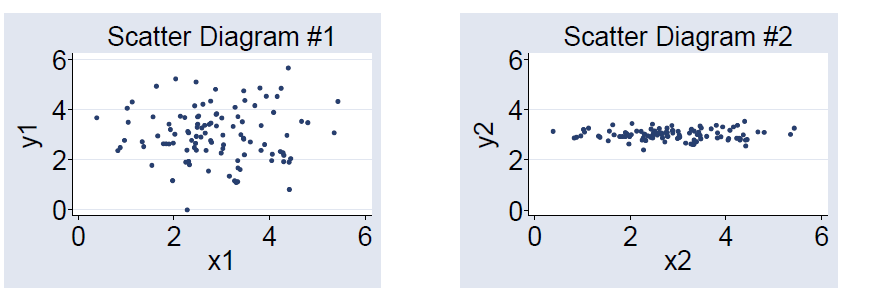
3. Calculate the mean of the X
4. Which best describes how the data in Scatter Diagram #2 differ from the data in following Scatter Diagram
Explanation
Explanation
Explanation
Explanation
Explanation
5. Suppose that within a very large corporation salaries are positively skewed with a mean of 40,000 dollars and a standard deviation of 20,000 dollars. Which statement is true for a sample of workers?
Explanation
Explanation
Explanation
Explanation
Explanation