
Fraunhofer Diffraction using Single-Slit and Circular Aperture
Step 1: Set the value of the wavelength (λ), angle (θ), and width of the slit (d) using the controls provided in the simulation.
Step 2: Click on either Diffraction Pattern or Intensity Profile to choose the display mode.
Step 3: When clicking on Diffraction Pattern, the pattern appearing on the screen is due to the single-slit aperture, as shown in Fig. 2.
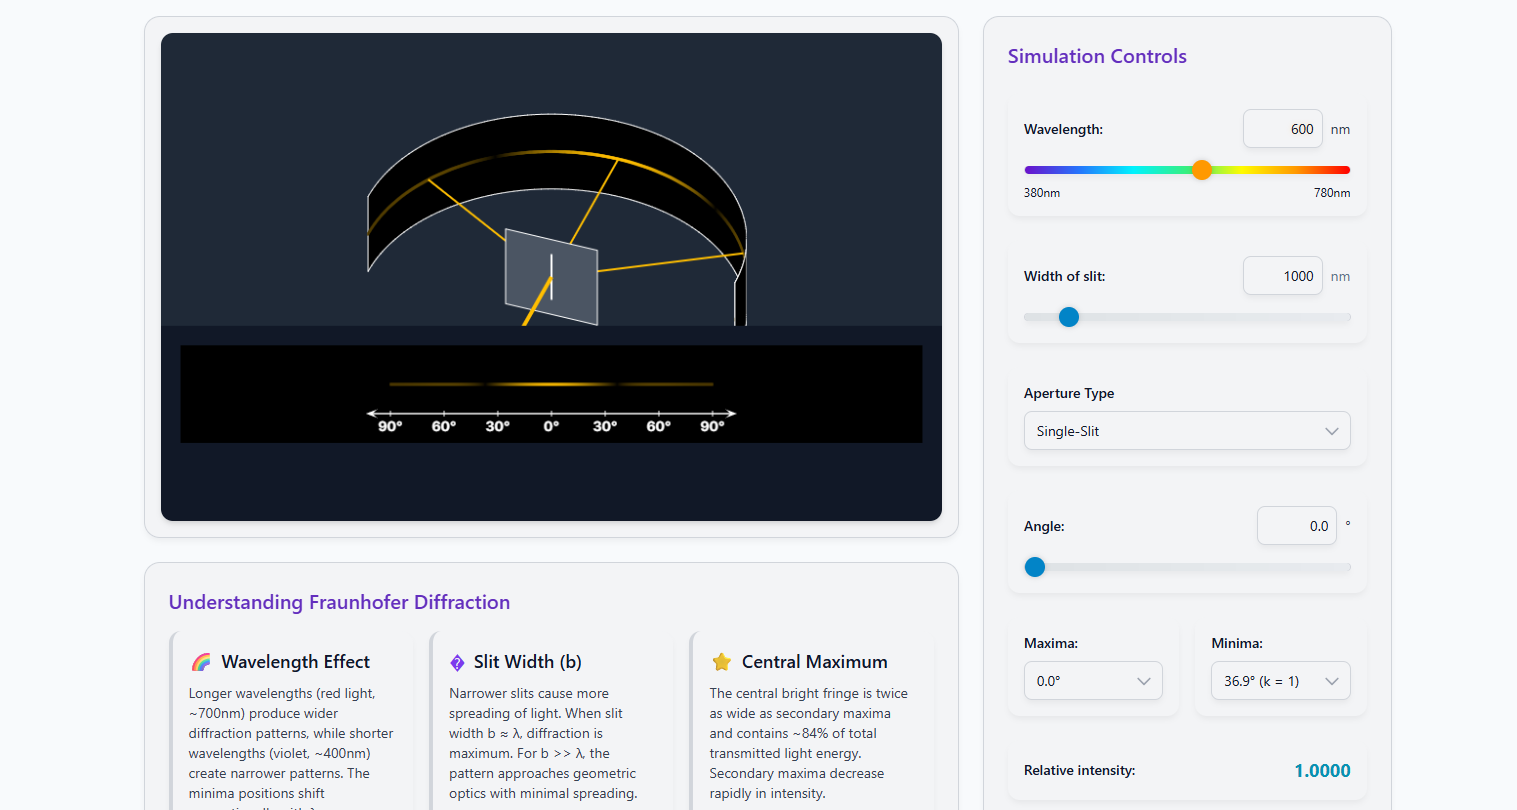
Fig. 2 — Diffraction Pattern due to Single-Slit Aperture
Step 4: If Intensity Profile is clicked, the pattern observed is as shown in Fig. 3. When k is set to 1, it will display two intensity profiles (one on each side of the central maximum).
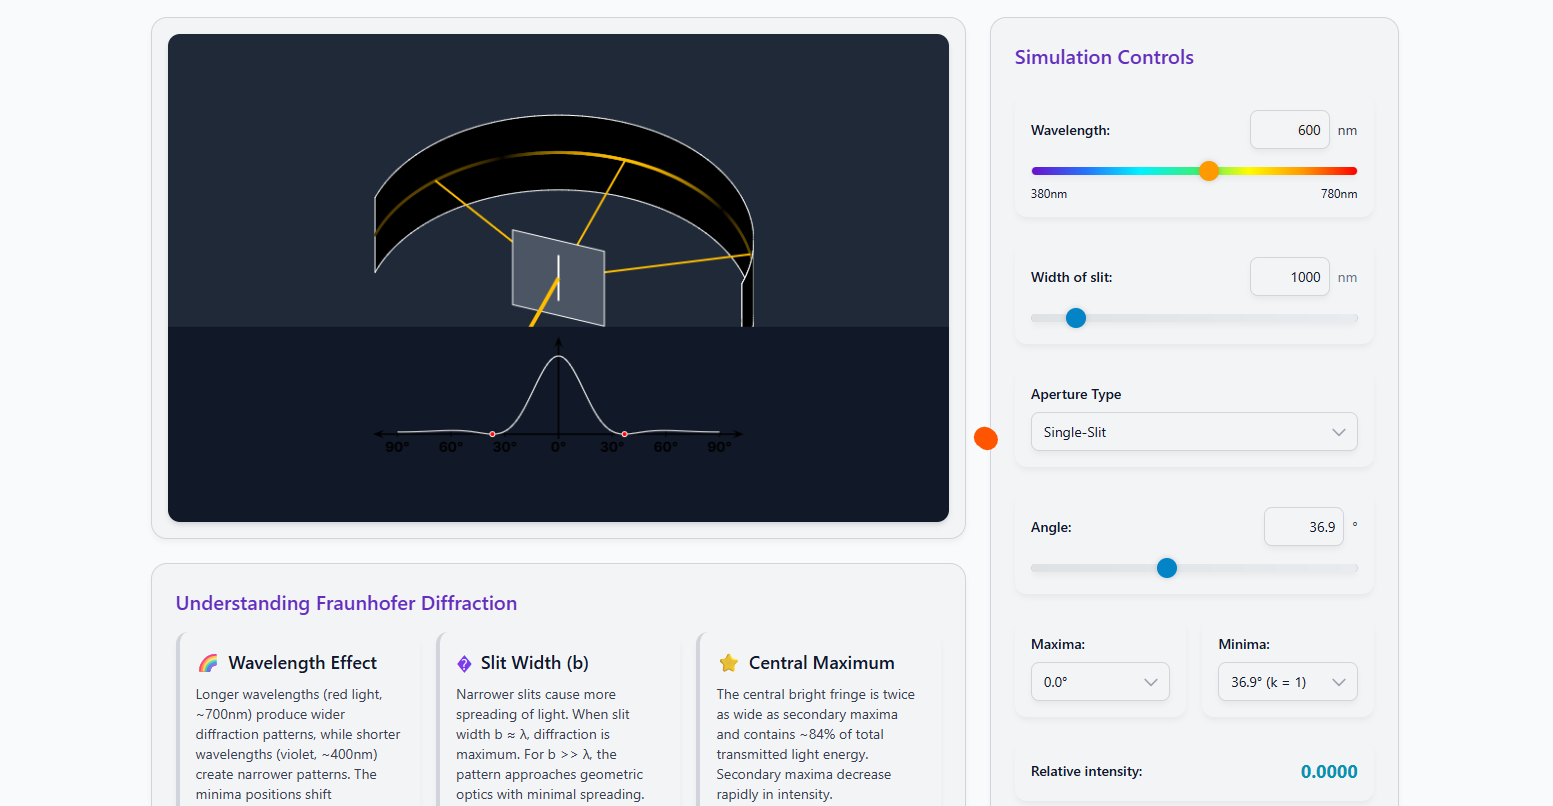
Fig. 3 — Intensity Profile due to Single-Slit Aperture
Step 5: Change the wavelength (λ) and the slit width (d) to observe different pattern formations. This provides an understanding of how the pattern varies with these parameters.
Step 6: Take 5–10 readings for different parameter values and record them in Table 1 and Table 2 below.
Table 1: Slit Width vs. Order of Minima
Fixed: Wavelength λ = 600 nm
Formula: d sinθ = kλ ⟹ θ = arcsin(kλ / d)
| S.No. | Slit Width d (nm) | sin θ | Angle of Minimum θ (degrees) | Calculated λ (nm) |
|---|---|---|---|---|
| 1 | 1000 | 0.60 | 36.870 | 600 |
| 2 | 1500 | 0.40 | 23.578 | 600 |
| 3 | 1500 | 0.80 | 53.130 | 600 |
| 4 | 2000 | 0.30 | 17.458 | 600 |
| 5 | 2000 | 0.60 | 36.870 | 600 |
| 6 | 3000 | 0.20 | 11.537 | 600 |
| 7 | 3000 | 0.40 | 23.578 | 600 |
| 8 | 4000 | 0.15 | 8.627 | 600 |
| 9 | 4000 | 0.30 | 17.458 | 600 |
| 10 | 5000 | 0.12 | 6.892 | 600 |
Table 2: Angle of Observation vs. Relative Intensity
Fixed: Slit width d = 1000 nm, Wavelength λ = 600 nm
Formula: I/I₀ = (sinα / α)², where α = πd sinθ / λ
| S.No. | Angle θ (degrees) | α = πd sinθ/λ (rad) | Relative Intensity I/I₀ | Remarks |
|---|---|---|---|---|
| 1 | 0.00 | 0.000 | 1.000 | Central maximum |
| 2 | 5.00 | 0.456 | 0.934 | |
| 3 | 10.00 | 0.909 | 0.754 | |
| 4 | 15.00 | 1.356 | 0.520 | |
| 5 | 20.00 | 1.792 | 0.297 | |
| 6 | 25.00 | 2.213 | 0.131 | |
| 7 | 30.00 | 2.618 | 0.037 | |
| 8 | 35.00 | 3.002 | 0.002 | |
| 9 | 36.87 | 3.142 | 0.000 | 1st minimum (k = 1) |
| 10 | 40.00 | 3.366 | 0.004 |