
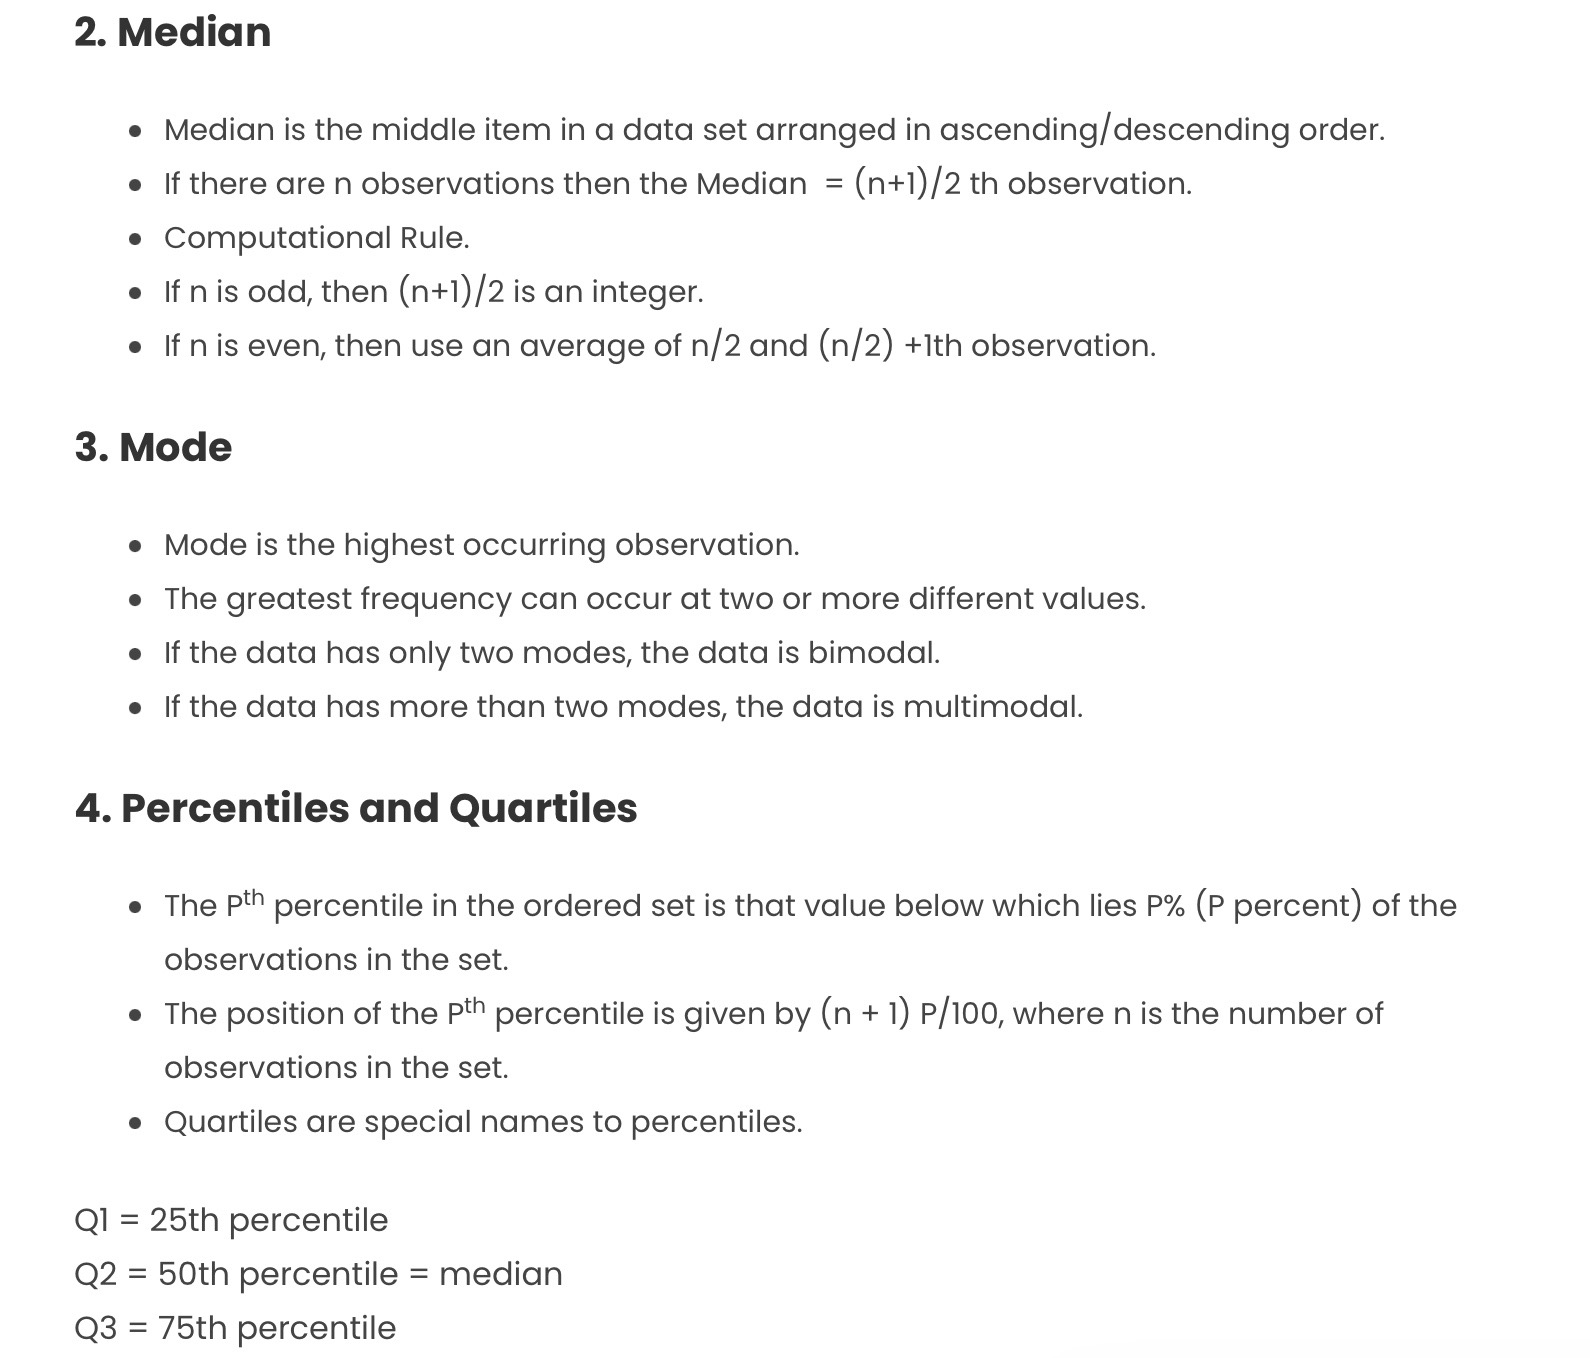
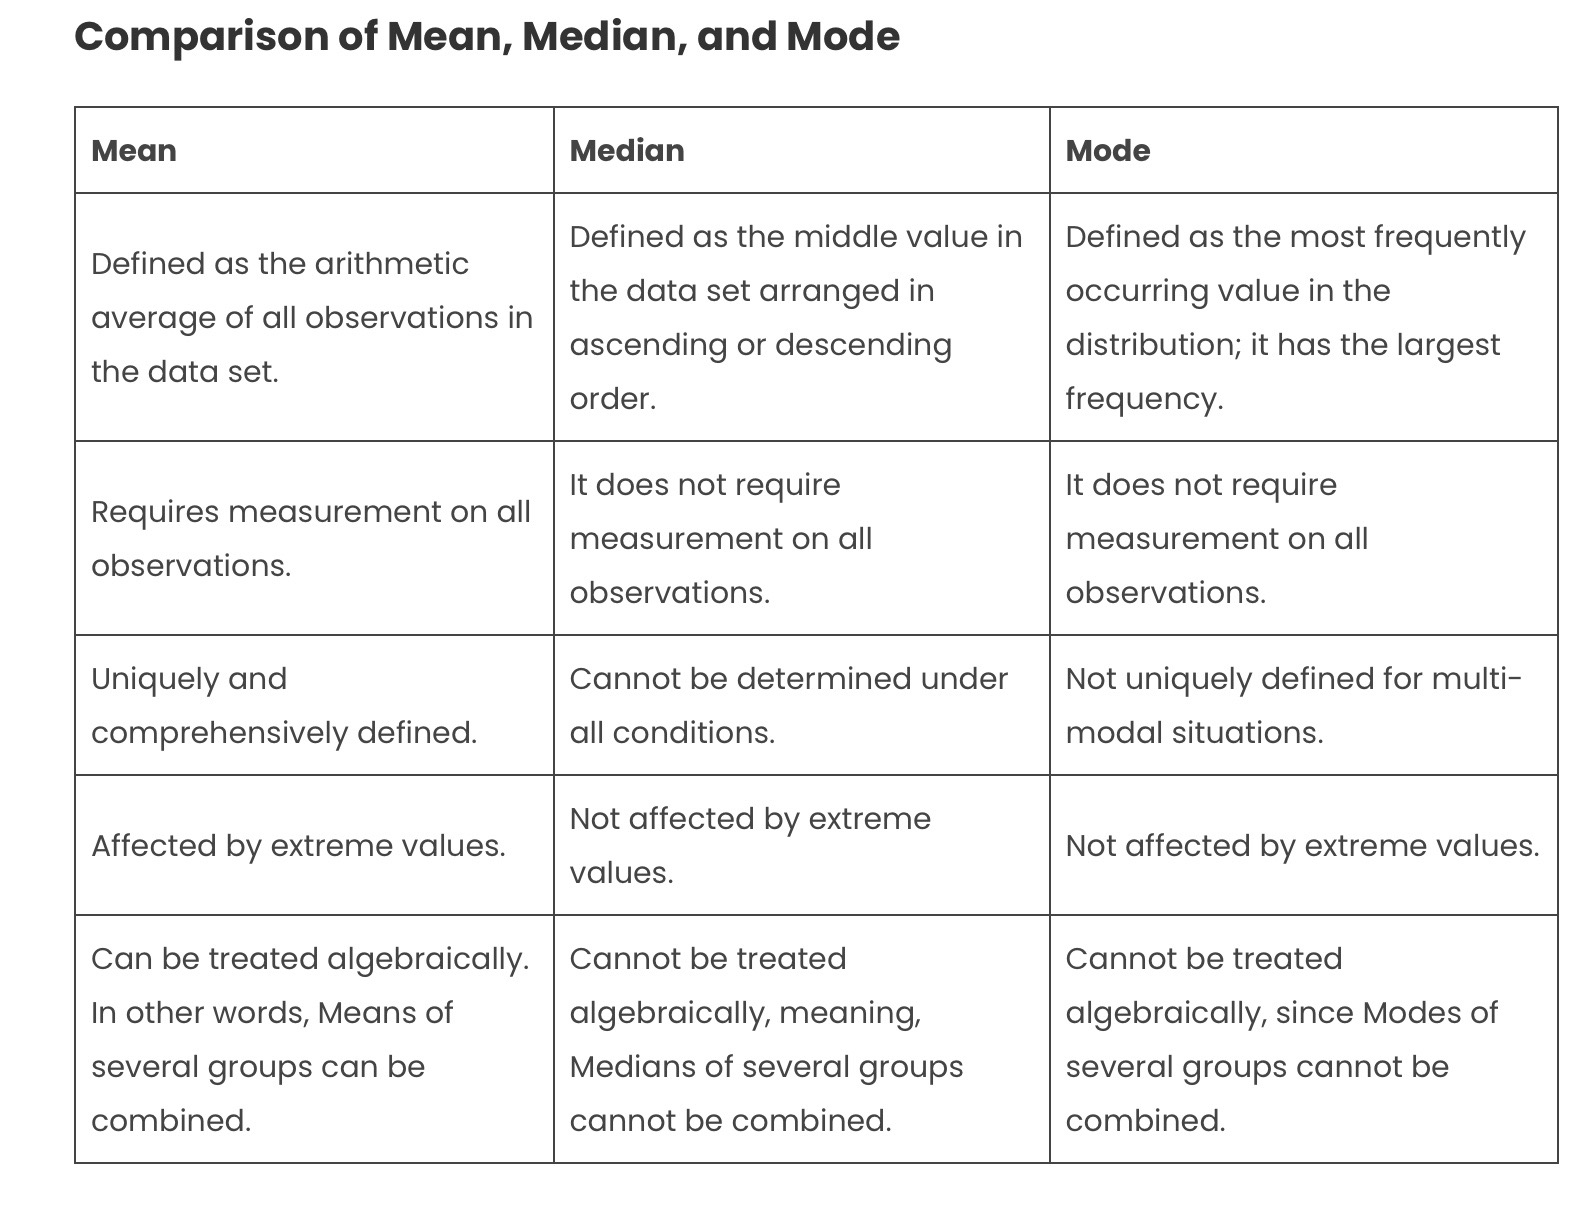
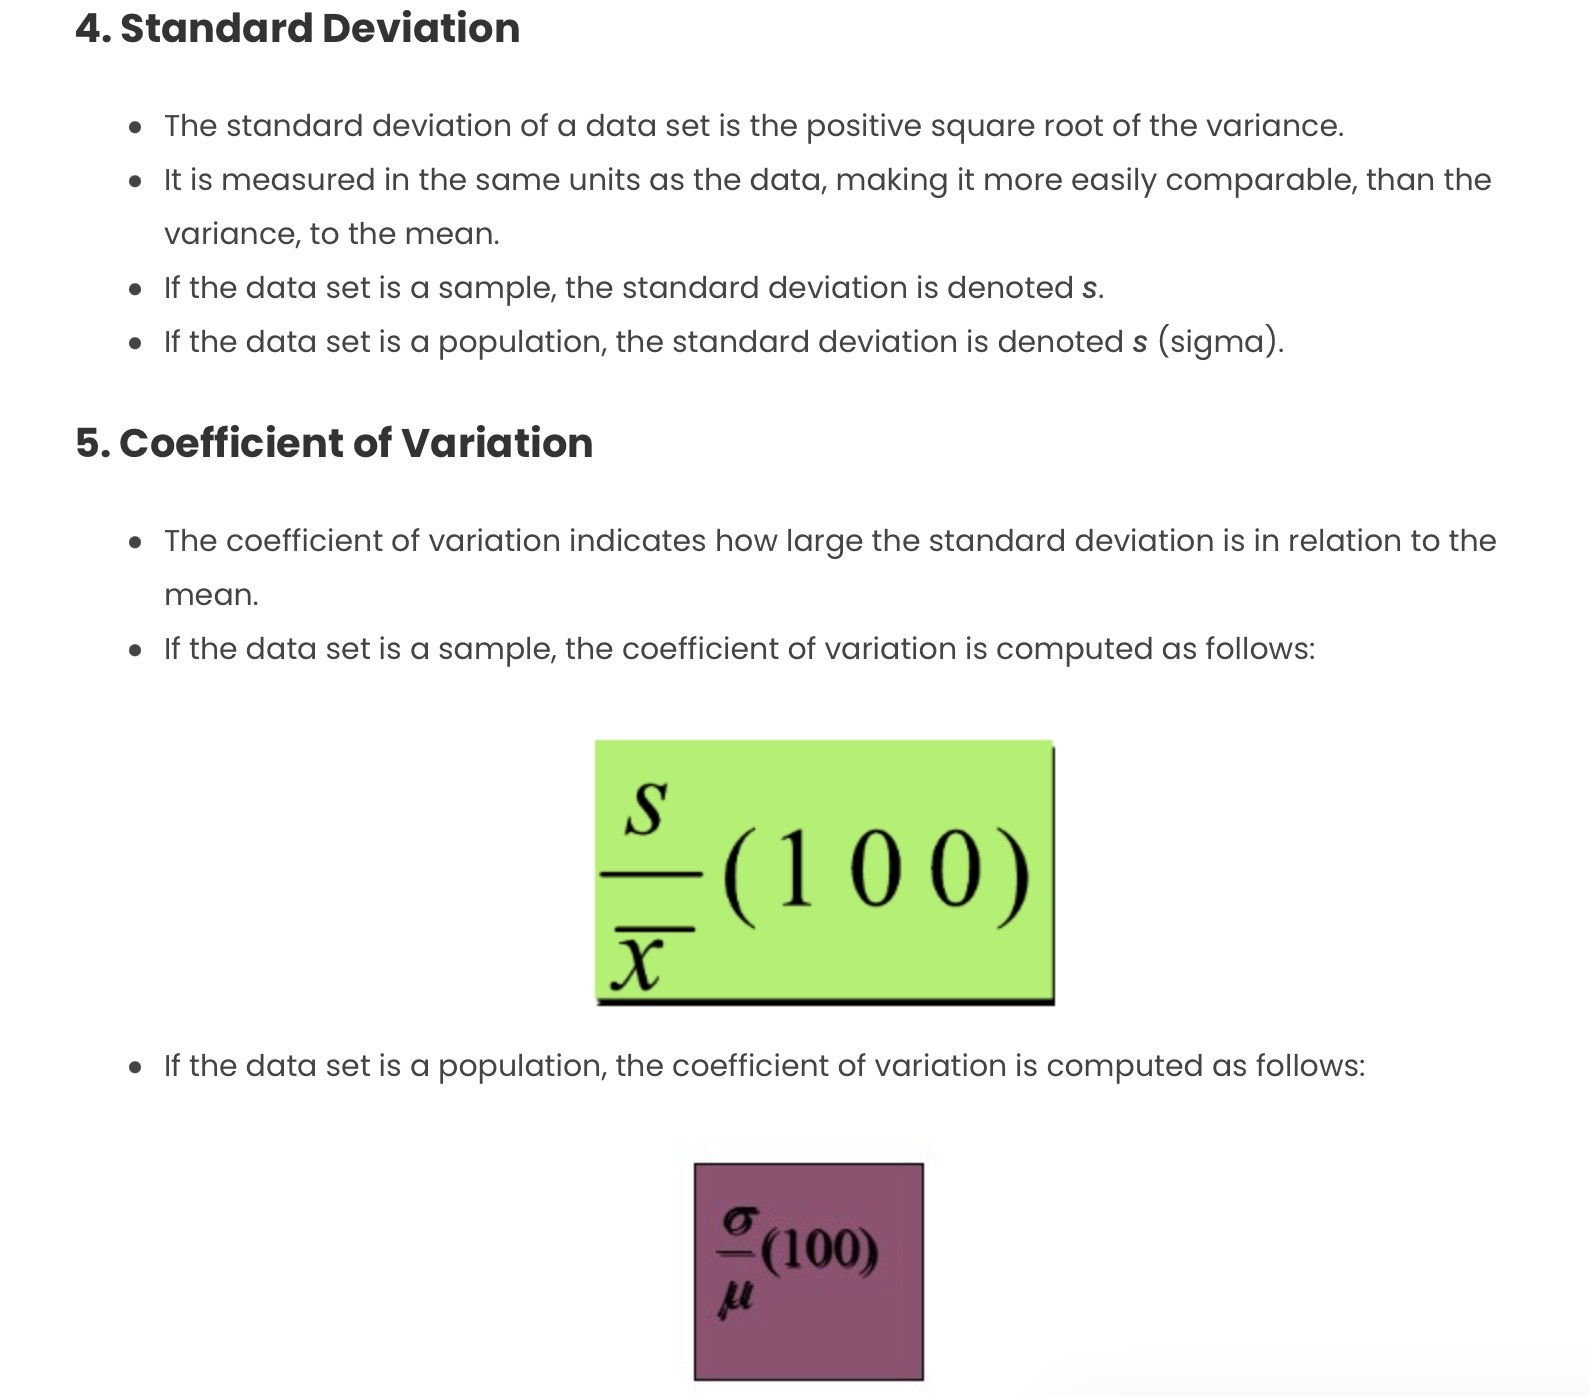
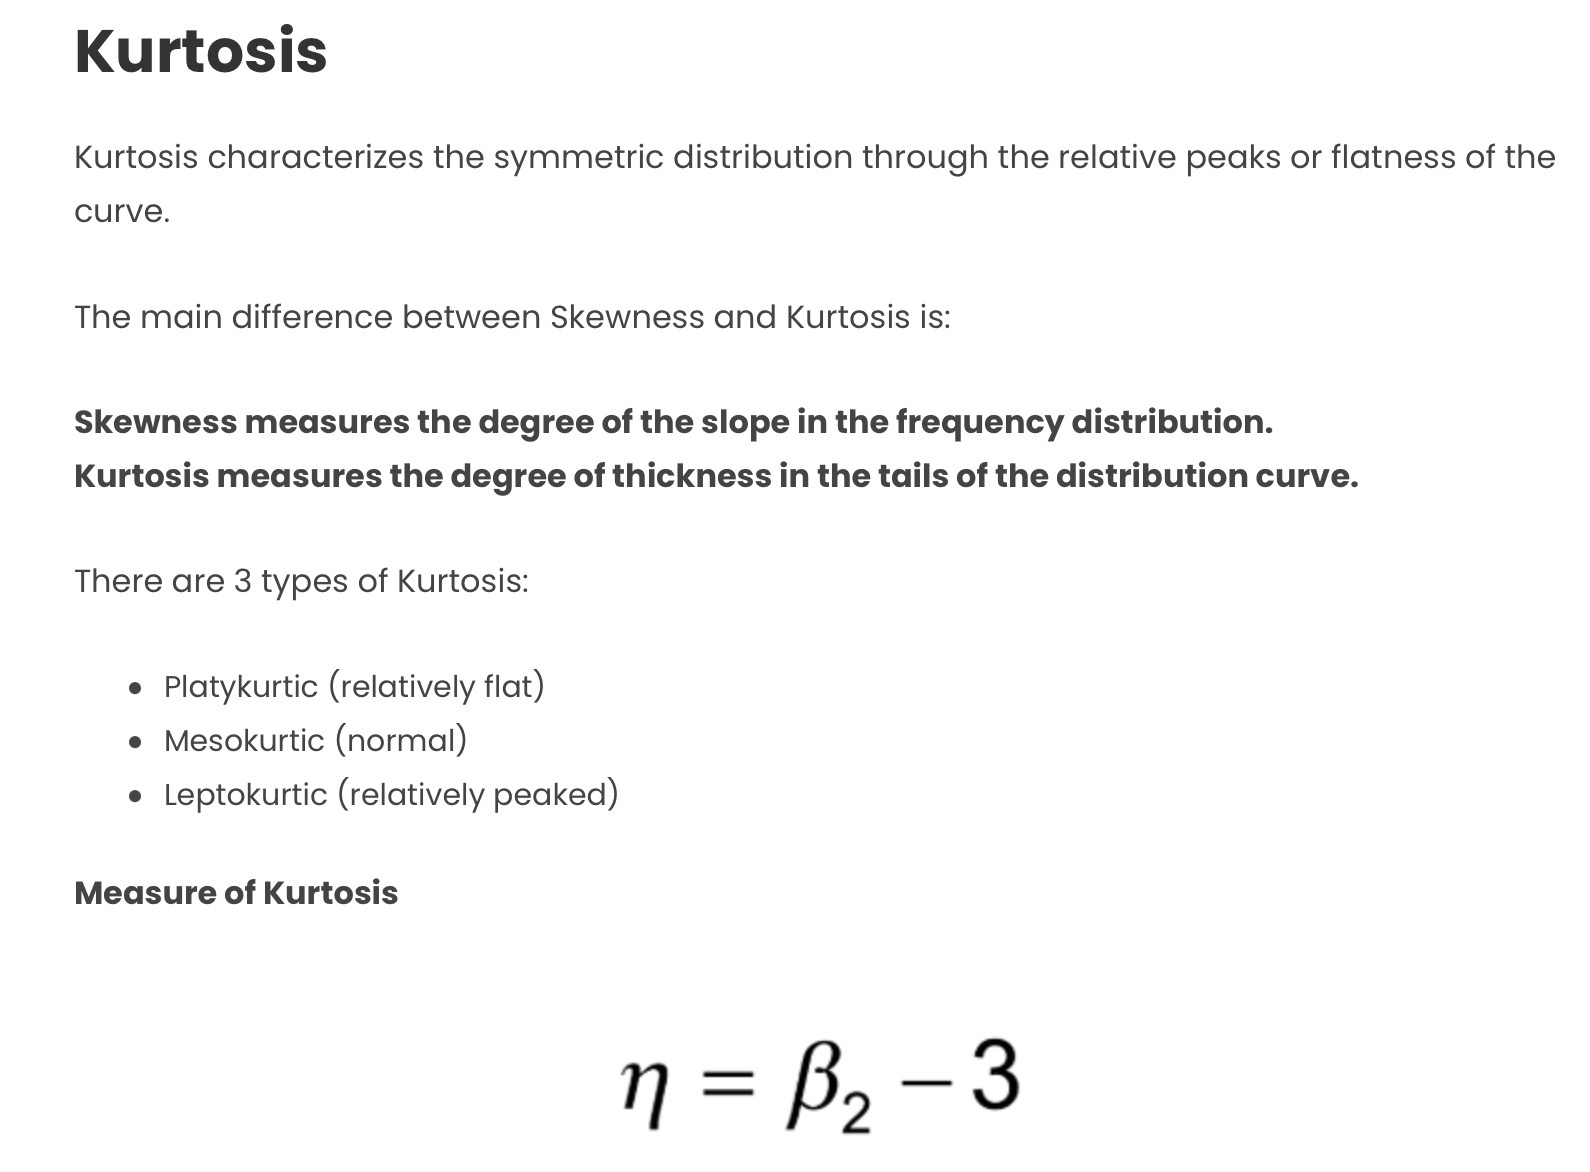
Descriptive statistics
.jpg)
.jpg)
.jpg)
Association between the two variables:
Scatter Plot:
• Scatter Plots are used to identify underlying relationships among pairs of data sets. • The plot consists of many scattered points, each point representing an observation. Based on the distribution in the dataset and the points in the scatter plot, we can infer the outliers in the dataset and the relationship between 2 variable
Covariance:
Covariance measures how two variables change together. If one variable tends to increase when the other variable increases, and decrease when the other decreases, they have a positive covariance. If one tends to decrease when the other increases, they have a negative covariance. If there's no consistent pattern, their covariance is close to zero.
Correlation Coefficient:
The correlation coefficient measures the strength and direction of the linear relationship between two variables. It ranges from -1 to 1.
- If it's close to 1, it means there's a strong positive linear relationship (when one variable increases, the other tends to increase).
- If it's close to -1, it indicates a strong negative linear relationship (when one variable increases, the other tends to decrease).
- If it's close to 0, there's little to no linear relationship between the variables.
Remember, correlation doesn't imply causation, and it only captures linear relationships.