
Estimation of precipitate size in age hardenable aluminium alloys
Electron microscopy is a powerful technique for measuring the precipitate size in age-hardenable aluminium alloys, which is crucial for tailoring the material's mechanical properties. The choice between scanning Electron Microscopy (SEM) and transmission electron microscopy (TEM) depends on the size of the precipitates. SEM is typically used when precipitate sizes are larger than 100 nm, while TEM is preferred for precipitates smaller than 100 nm. Preparing a sample for TEM requires thinning the material to less than 100 µm, which is a meticulous and delicate process. Initially, the sample is cut using a diamond cutter or other precision cutting tools, followed by careful grinding to reduce its thickness to approximately 100 µm. The sample is then punched into 3 mm diameter disks, which are further thinned using electro jet polishing. Once the sample is adequately thinned, TEM imaging is performed to capture detailed images of the precipitates. TEM provides only a 2D projection, which does not represent the true size of the features. Similar to SEM analysis, image processing software is used to measure and analyse precipitate sizes, providing data on average size, distribution, and standard deviation.
True diameter calculation of plate-like precipitates in Al-Cu-Li alloys:
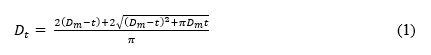
Where, Dm is the measured diameter and t is sample thickness. The thickness of TEM sample is measured using convergent beam electron diffraction (CBED) which is based on the variation in the diffracted beam intensity. Thickness measurements are made under two beam conditions with one strongly excited (hkl) reflection, where CBED discs have parallel intensity oscillations instead of concentric. The central bright fringe is in the exact Bragg condition. The fringe spacing corresponds to angles ∆θi and from this spacing the deviation si for the ith fringe can be determined using eq. (2).
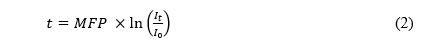
Here, λ is wavelength of incident electrons, θB is Bragg angle for the diffracted plane, and d is the interplanar spacing. The FCC {200} peaks is considered for CBED pattern.
Furthermore, to measure the thickness (t) of the TEM sample, plotting 1/nk2 vs ss2/nk2 should give intercept equal to 1/t2 as per eq. (3).
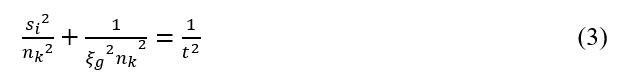
Here, nk is an integer having values ranges from 1,2,3, …… and 1 is corresponds to first fringe and so on and ξg is extinction distance.
The volume fraction of precipitates can be obtained by using following equation.
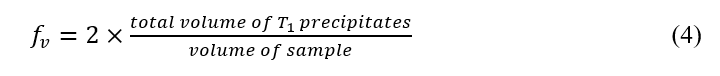
Here factor of 2 corresponds of number of precipitate variants along the <110> zone axis. It vary with zone axis of TEM imaging.
The sample volume is volume of observed area under TEM, which can be written as xyt. Where, x and y are dimensions of TEM image and t is TEM sample thickness.
Procedure of the simulator of the experiment:
- Take TEM images
- Using ImageJ first set the scale bar
- Measure the length of precipitates using line measurement in ImageJ
- Calculate the si = (λ∆θi)/(2θBd2) using wavelength (λ), the fringe spacing corresponds to angles (∆θi), Bragg angle of diffraction (θB), and interplanar spacing (d).
- Plot si2/nk2 vs 1/nk2 and calculate the intercept on y-axis which will be equal to 1/t2 .
Use table format to calculate the data points for the plotting. For nnk starts with 1,2,3 if the data points don’t follow linear line, then starts with 2,3,4 and iterate the process.
Table 1: TEM foil thickness procedure using convergent beam electron diffraction pattern (refer Fig. 2).
| ∆θᵢ | Si (107 nm⁻¹) | nk | 1/nk² | Si²/nk² (10¹³ nm⁻²) |
|---|---|---|---|---|
| 6.67 | 1.02 | 4 | 0.0625 | 0.64 |
| 10.71 | 1.63 | 5 | 0.040 | 1.07 |
| 15.00 | 2.29 | 6 | 0.0278 | 1.45 |
- Calculate the sample thickness using convergent beam electron diffraction which is of the order of ~220 nm
- Correct the measured precipitate size using equation (1)
Example: Plate-like T1 (Al2CuLi) precipitate in Al-Cu-Li alloys as shown in figure 1.
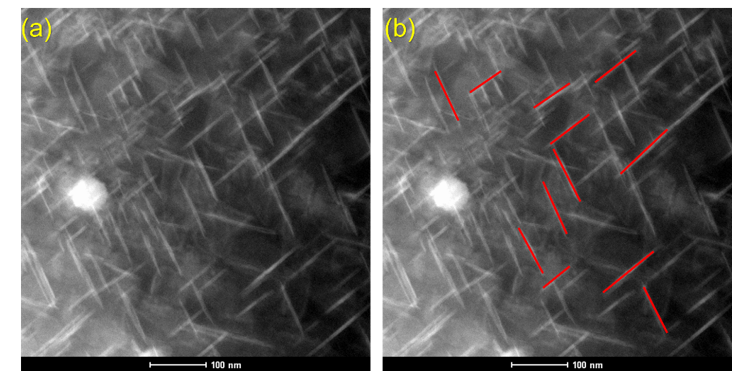
Figure 1: (a) Plate-like T1 precipitate in Al-Cu-Li alloy. (b) Precipitates which were used to calculate the diameter of plate-like precipitates.
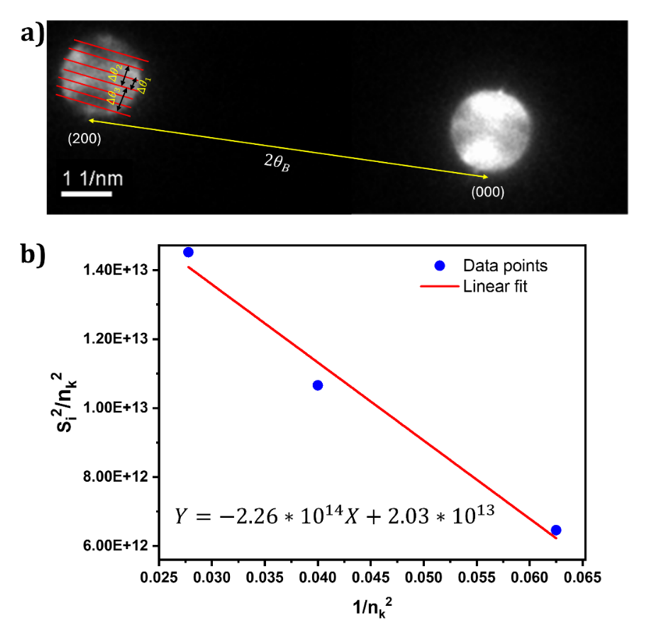
Figure 2: (a) Convergent beam electron diffraction pattern of Al-Cu-Li alloy. (b) The data points used for linear fitting corresponding to the Fig. 2(a). Thickness is equal to (1/intercept)0.5.
Table 2: Measured diameter of the marked red colour precipitates.
| S. No. | Measured diameter (nm) | Corrected diameter (nm) |
|---|---|---|
| 1 | 98.68 | 106.1022 |
| 2 | 102.65 | 110.6058 |
| 3 | 85.58 | 91.34153 |
| 4 | 86.19 | 92.0253 |
| 5 | 65.89 | 69.47496 |
| 6 | 76.91 | 81.66299 |
| 7 | 82.96 | 88.40883 |
| 8 | 57.56 | 60.35342 |
| 9 | 84.57 | 90.21019 |
| 10 | 54.87 | 57.42566 |
| 11 | 54.60 | 57.1323 |
| 12 | 42.666 | 44.25977 |