Efficient RNA secondary structure prediction using the Zuker Algorithm
Procedure
Procedure-Efficient RNA secondary structure prediction using the Zuker Algorithm
Step 1.
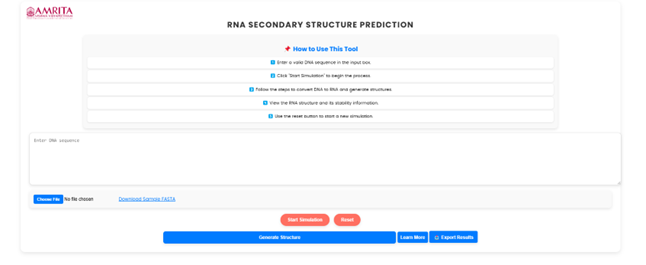
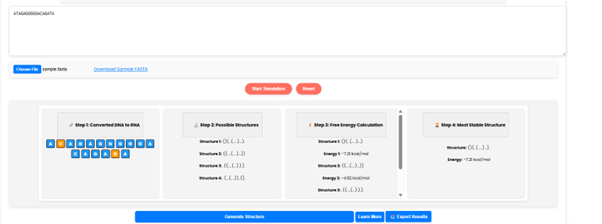
Open the simulator tab where user can find a user-friendly interface with different options to run the experiment.

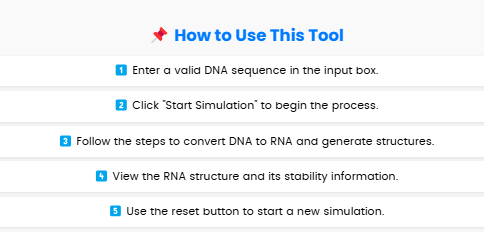
• Instructions are provided under the “How to use this Tool” section. Read through them to get familiar with the process.
Step 2.
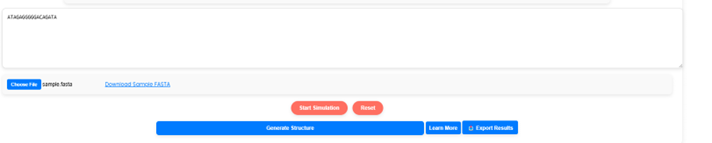
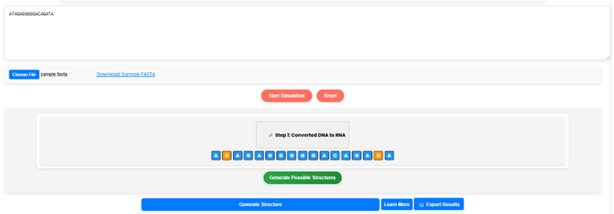
User can manually enter a DNA sequence in the input box. Alternatively, download a sample .fasta DNA file from the page and upload it using the “Choose File” button. Click on “Start Simulation” to begin the experiment.
Step 3.
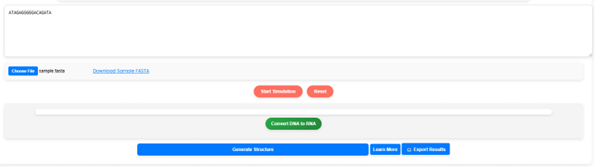
Since RNA is derived from DNA, user need to convert the DNA sequence. Once the simulation starts, a “Convert DNA to RNA” button will appear. Click this button to proceed with the conversion

Step 4.
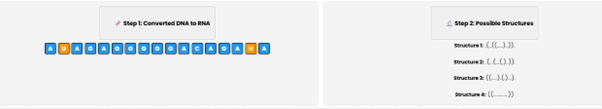
After conversion, click on “Generate Possible Structures” to predict different possible RNA secondary structures.
Step 5.
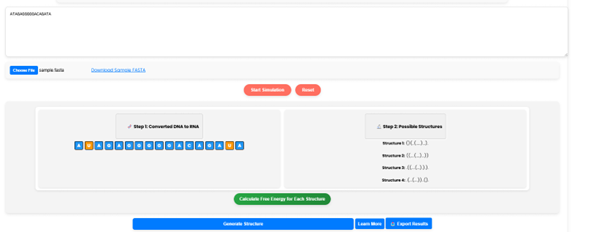
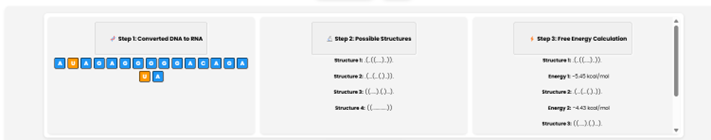
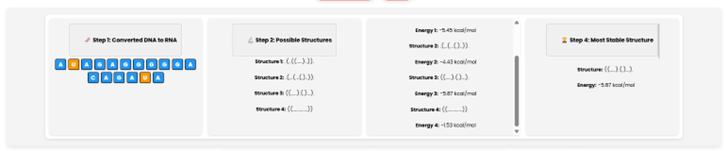
To determine the stability of each structure, click on “Calculate Free Energy for Each Structure”. The simulator will compute the Gibbs free energy, which helps in identifying the most stable structure.
Step 6.
Click on “Show Most Stable Structure” to see the most stable RNA structure. The system will display Structure 3 as the most stable, with a free energy value (e.g., -5.87 kcal/mol).
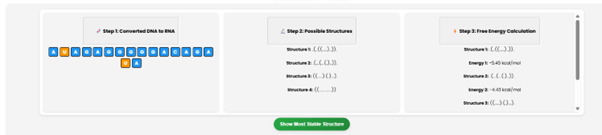
Interpretation of the Dot-Bracket Notation Key from the figure
Step 1 is the conversion of DNA to RNA
Step 2 is the possible RNA secondary Structure Predictions.
- Structure 1: (((...)))
A stem-loop (hairpin) with 3 base pairs on each side enclosing a 3-nucleotide loop in the middle. Indicates a classic hairpin loop with strong base pairing.
- Structure 2: ((...)).
A 2-base-pair stem followed by a 3-nucleotide loop, then a single unpaired nucleotide. Slightly less stable than structure 1 due to fewer base pairs and more unpaired regions.
- Structure 3: (......)
A 1-base-pair stem enclosing a 6-nucleotide loop. Much less stable due to minimal pairing.
- Structure 4: (.). (.)..
Multiple small, separated stem elements with mostly unpaired regions. The least stable structure due to minimal pairing and high entropy.
Step 3 calculate the Gibbs free energy of each structure.
Step 4 predict the most stable structure as structure 3 with -5.87 kcal/mol.
Step 7.
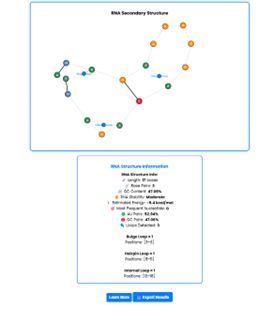
Click on “Generate Structure” to get a clear visualization of the most stable RNA secondary structure.
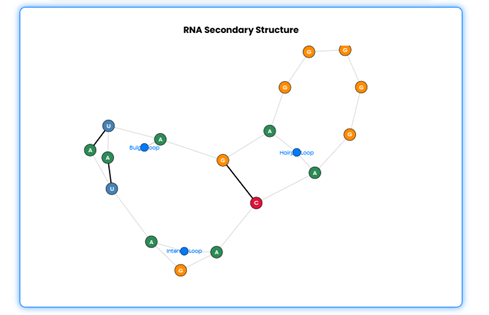
•Additionally, RNA structure information will also be displayed.
Step 8.
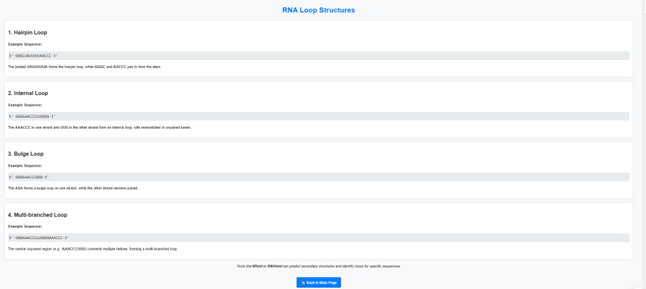
Click on “Learn More” to explore detailed information about RNA loop structures.
Step 9.
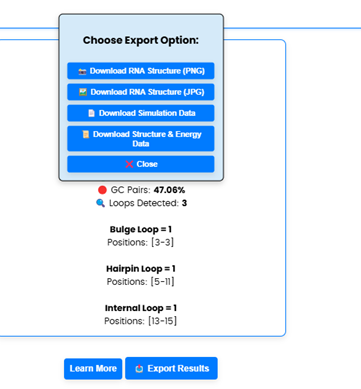
User can save the results in .png or .jpg format by clicking the “Export Results” button.
Step 10.
User can repeat the experiment, click on the “Reset” button to clear the current data and start again.