
Determine Frequency Response of Zero Order Hold and First Order Hold using Actual Transfer Functions and Pade Approximations 
Procedure
Steps to perform the simulation
- At first enter the desired values of minimum frequency, maximum frequency and sampling time. Here default values are 1 for minimum frequency, 100 for maximum frequency and 0.1 for sampling frequency.
- Click on 'Select method for linear scale' dropdown-menu and select the desired option.
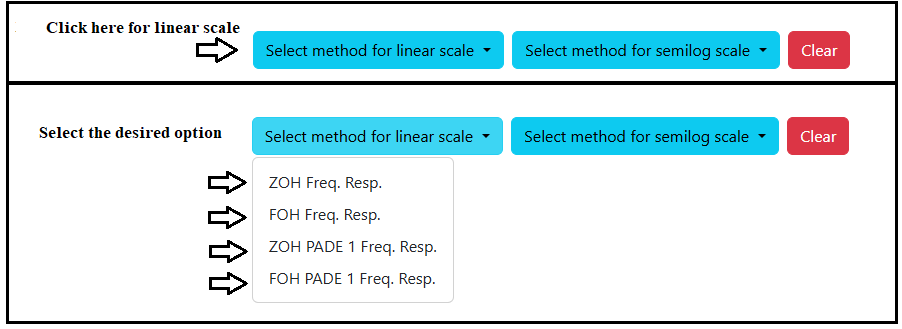
Fig.2. Selecting method for linear scale simulation
- Click on 'Select method for semilog scale' dropdown-menu and select the desired option.
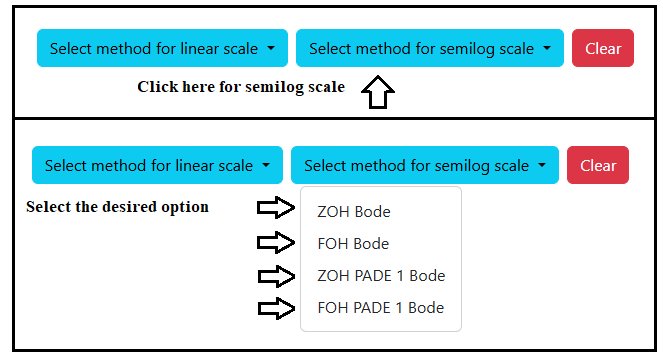
Fig.3. Selecting method for semilog simulation
- Click on 'Plot' button for simulation.
- Click on the 'Download Plot' button to download the simulation results.
- Click on 'Clear' button before every simulation to clear the previous plot.
- To compare plots, select the desired options from the dropdown-menu without using the 'Clear' button.
- Place the cursor on the plot to read the exact values at any point for detailed analysis.
- Note: A maximum of four frequency response experiments can be conducted and plotted for comparison.
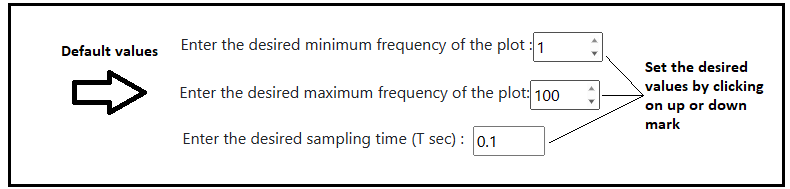
Fig.1. Maximum, Minimum Frequency and Sampling time values entry