
Spectrometer i-i' curve
Theory
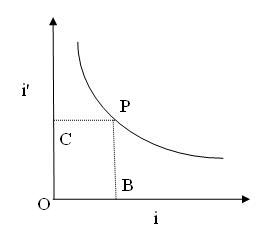
Figure 1
The graph connecting the angles i and i' is shown in fig(1). The bisector, meets the curve at P. At the point P, i and i' are equal.
The angle of deviation s is given by
Where A is teh angle of the prism.
When i =i' , the deviation is minimum (D).
Hence,
Therefore,
The refractive index of the prism,
Where is difference between the reflected ray and direct ray.
Spectrometer i-i' curve
A graph is drawn with angle of incidence i along X-axis and the angle of emergence i' along Y-axis (Figure 1). The graph is a rectangular parabola. from it, angle of incidence corresponding to minimum deviation is calculated.