Quantum Kernel Alignment in Machine Learning
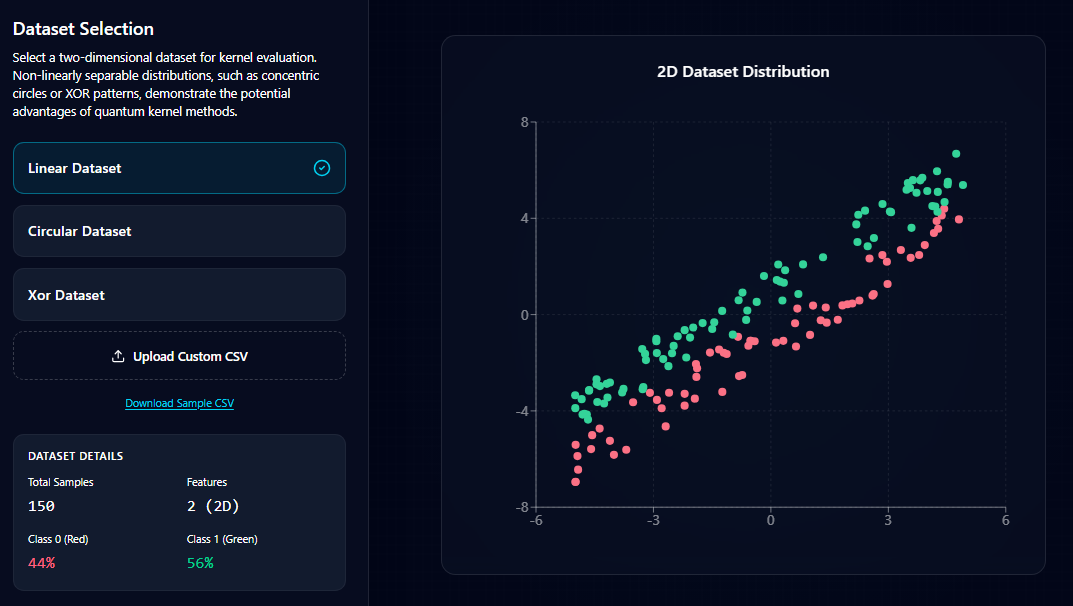
- Dataset Selection
Select a dataset from the available options (Linear, Circular, or XOR) or upload your own dataset using the Upload Custom CSV option.
Once a dataset is selected, the system displays:
- The 2D dataset distribution on the right side as a scatter plot.
- Dataset details, including the number of samples, number of features, and class distribution.
This step allows you to visually inspect the dataset before applying kernel methods.
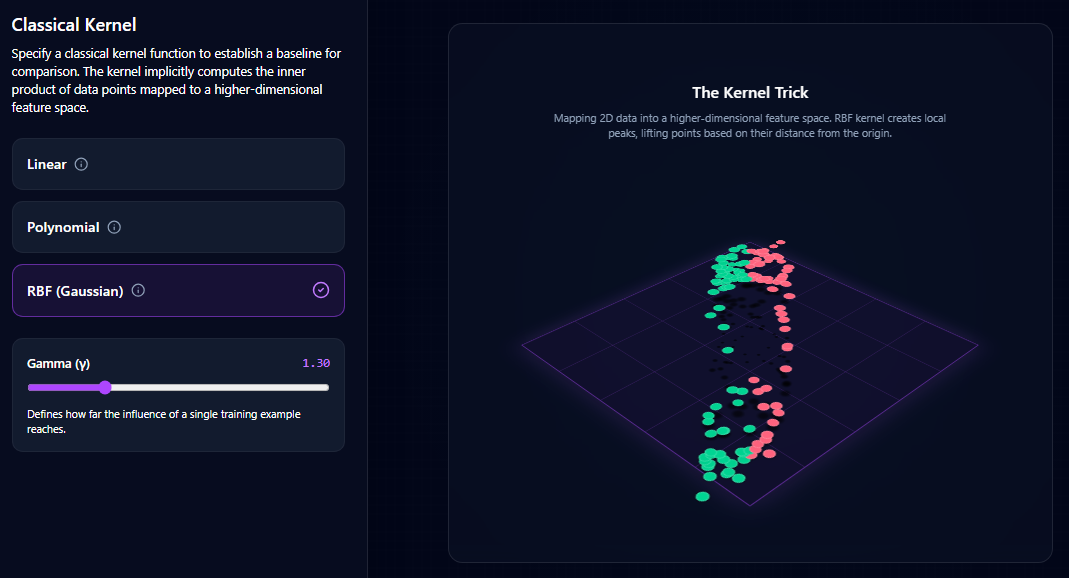
- Kernel Selection
Choose a classical kernel function that will serve as the baseline for comparison.
Available kernel options include:
- Linear Kernel
- Polynomial Kernel
- RBF (Gaussian) Kernel
If the RBF kernel is selected, adjust the gamma (γ) parameter using the slider to control the influence range of individual data points.
This step defines how the classical model transforms the dataset into a higher-dimensional feature space.
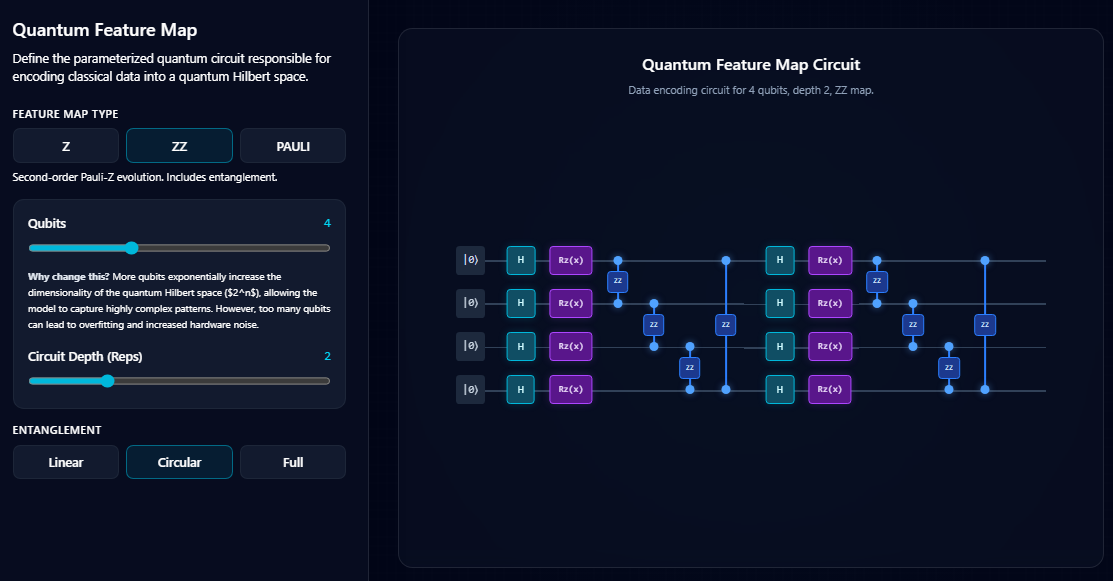
- Quantum Feature Map Configuration
Configure the quantum feature map, which encodes classical data into a quantum Hilbert space.
Perform the following settings:
- Select a feature map type (Z, ZZ, or Pauli).
- Use the Qubits slider to define the number of qubits in the circuit.
- Use the Circuit Depth (Reps) slider to set the number of circuit repetitions.
- Choose the entanglement structure (Linear, Circular, or Full).
The quantum circuit diagram is displayed on the right side to visualize how the data will be encoded.
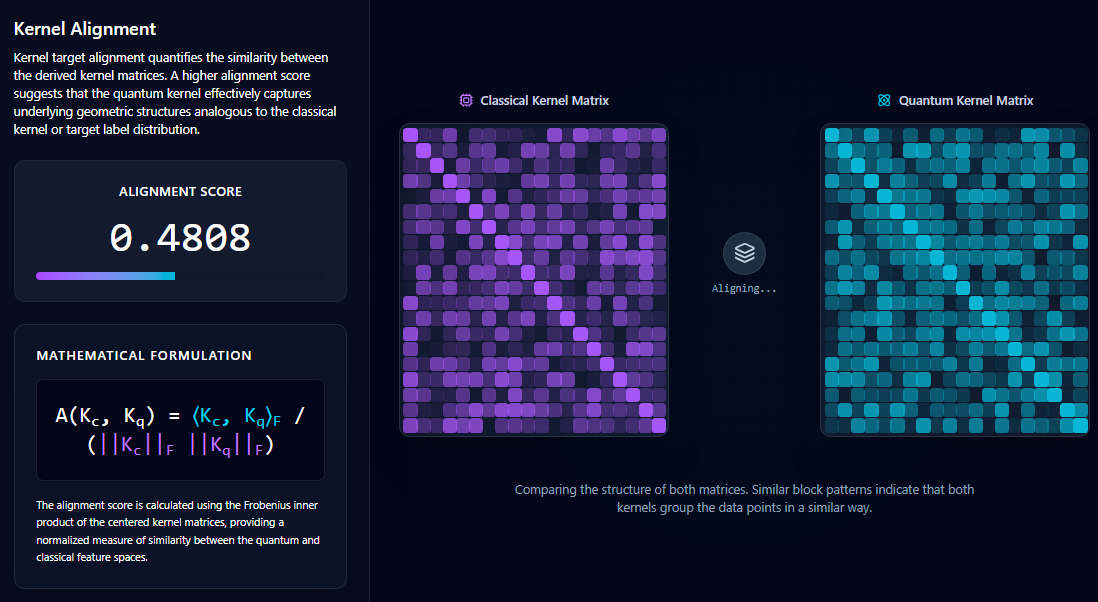
- Kernel Alignment Analysis
Click the Simulate button to compute and compare the kernel structures.
The system will display:
- The Kernel Alignment Score, which measures the similarity between classical and quantum kernel matrices.
- The Classical Kernel Matrix visualization.
- The Quantum Kernel Matrix visualization.
Higher alignment values indicate that the quantum kernel captures data relationships similar to the classical kernel.
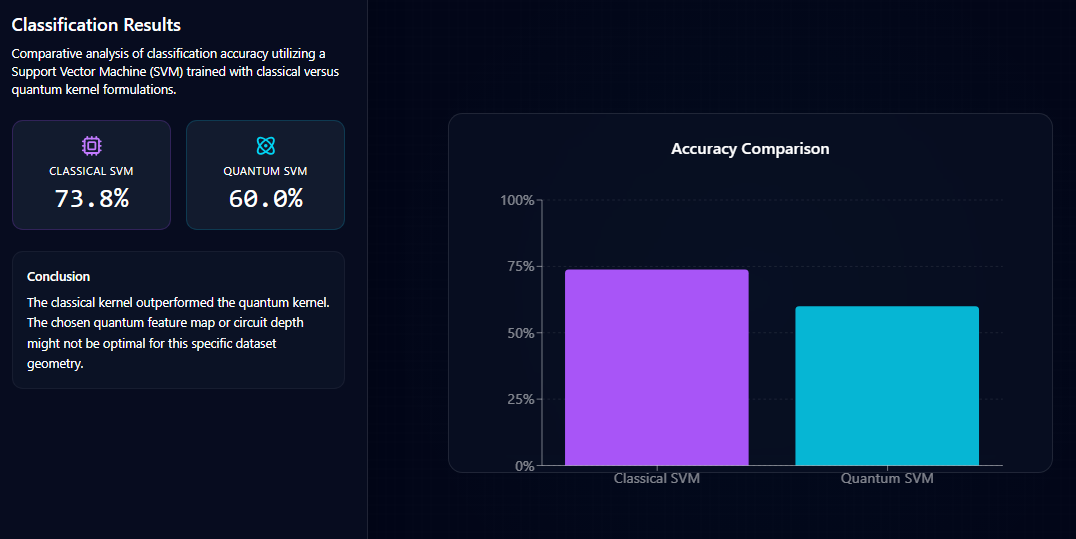
- Classification Results
Finally, the system trains Support Vector Machine (SVM) models using both classical and quantum kernels.
The results section shows:
- Classification accuracy for the Classical SVM
- Classification accuracy for the Quantum SVM
- A visual comparison chart
This step allows users to evaluate how effectively the quantum kernel performs compared to the classical kernel for the selected dataset.