
Quantitative X-ray Metallography using Electron Probe Micro Analyzer
Electron Probe Microanalyzer (EPMA):
An Electron Probe Microanalyzer (EPMA) is an electron beam instrument primarily used for the in situ chemical examination of solid materials. The electron optics of EPMA allow for much higher resolution compared to visible-light lenses, enabling a spot size of a few microns. This high resolution makes EPMA a powerful tool for material analysis.
EPMA can be equipped with a variety of detectors, including :
• Wavelength Dispersive Spectrometers (WDS)
• Energy Dispersive Spectroscopy (EDS)
• Secondary Electron Detectors
• Backscattered Electron Detectors
A schematic of EPMA is shown in Figure 1.

Electron Beam Interaction in EPMA :
Electrons from the electron source (such as LaB₆ or Field Emission Gun) are accelerated and focused onto the sample using a series of electromagnetic lenses. The interaction of the electron beam with the sample results in several effects :
• Secondary Electrons (SEs): Used for imaging surface morphology.
• Backscattered Electrons (BSEs): Used for compositional contrast imaging.
• Cathodoluminescence (CL): Provides information on electronic structure.
• Continuum X-ray Radiation: Background radiation generated during interaction.
• Characteristic X-ray Radiation: Used for elemental analysis.
• Auger Electrons: Used for surface chemistry analysis.
Among these, characteristic X-rays are particularly useful for chemical analysis since each element has a unique inner electron structure, which serves as a fingerprint for elemental identification. Characteristic X-rays are emitted when an inner shell electron (e.g., K-shell) is ejected and an outer electron (e.g., L-shell) fills the vacancy. The energy difference results in X-ray emission, classified into different X-ray lines :
• Kα, Kβ (for K-shell transitions)
• Lα, Lβ (for L-shell transitions)
• Mα, Mβ (for M-shell transitions)
However, in multi-element materials, X-ray peaks can overlap due to Close energy values of different X-ray lines and it is predominant in High atomic number (Z) elements, exhibiting multiple emissions. This issue is more prominent in EDS, where energy resolution is lower. WDS provides a solution by using crystal diffraction, offering higher resolution and reducing peak overlap. The X-rays emitted from the sample are counted either by EDS or WDS detector.
Wavelength Dispersive Spectrometry (WDS) and Rowland Circle:
The key advantage of EPMA over SEM is the use of Wavelength Dispersive Spectrometer (WDS), which provides higher spectral resolution compared to EDS. In WDS, X-rays emitted from the sample interact with a diffracting crystal of known d-spacing, which selectively diffracts X-rays of specific wavelengths (λ), and these diffracted X-rays are collected by a detector. To ensure proper detection of X-rays, all three components (sample, diffracting crystal and detector) are placed in a specific geometry known as Rowland Circle.
The Rowland Circle is a fundamental concept in WDS, where the sample, diffracting crystal, and detector are positioned on a curved geometric arrangement to ensure the distance between the sample and diffracting crystal, and diffracting crystal and detector, which results in only X-rays satisfying Bragg’s Law are detected. This technique enhances spectral resolution and reduces peak overlap, making WDS superior for precise compositional analysis.
Figure 2 illustrates this setup and table 1 shows Comparison of EDS and WDS.

Table 1. Comparison of EDS and WDS :
| Feature | Energy Dispersive Spectroscopy (EDS) | Wavelength Dispersive Spectroscopy (WDS) |
|---|---|---|
| Resolution | Energy dependent (130 eV) | Crystal dependent (~ 5 eV) |
| Detection Limit | ~ 0.1 wt% | ~ 0.01 wt% |
| Speed | Faster (few minutes) | Slower (tens of minutes) |
| Elemental Sensitivity | Less sensitive to trace elements | More sensitive to trace elements |
| Peak Overlap | Higher | Lower due to better spectral resolution |
| Quantification Accuracy | Moderate | High due to fewer matrix effects |
Quantitative Analysis and ZAF (Matrix) Corrections:
Quantitative X-ray microanalysis aims to determine the composition of a sample by measuring the intensity of characteristic X-ray emissions. The X-rays detected are used to generate a spectrum, which is compared with reference spectra to determine the chemical composition However, direct intensity measurements must be corrected for matrix effects, which include atomic number effects (Z), absorption (A), and fluorescence (F), also known as ZAF correction.
• Penetration factor (Z): Accounts for electron backscattering (R) and stopping power (S)
• Absorption (A): Considers X-ray attenuation within the sample.
• Secondary fluorescence (F): Corrects for additional X-ray emissions caused by one element exciting another.
Finally, the gathered chemical data is interpreted within a textural context. An example of a high-entropy ceramic analysis is shown in Figure 3.
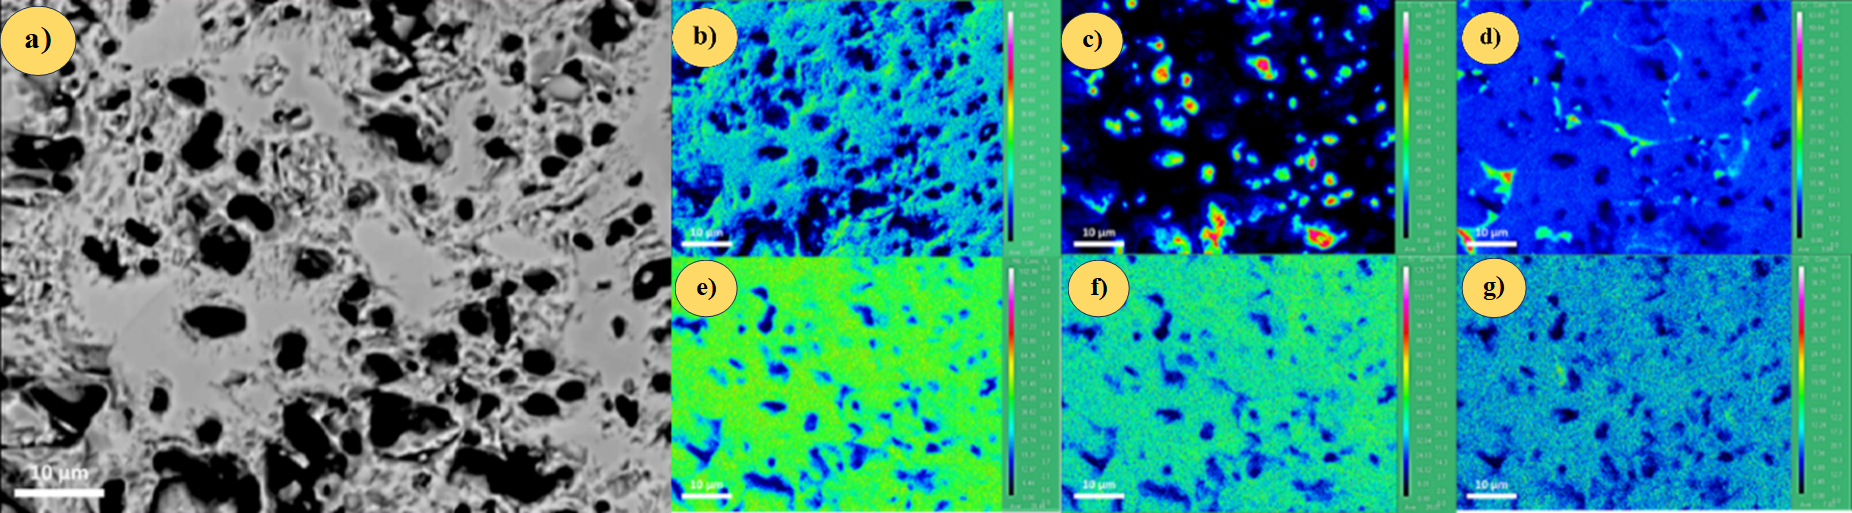
Fig 3. Electron probe microanalysis (EPMA) results of the sintered pellet of TiZrNbCrBC ceramic a) BSE image b) B, c) C, d) Cr, e) Nb, f) Ti, and g) Zr.