
Pressure distribution over a circular cylinder 
Procedure
Required Apparatus
Windtunnel
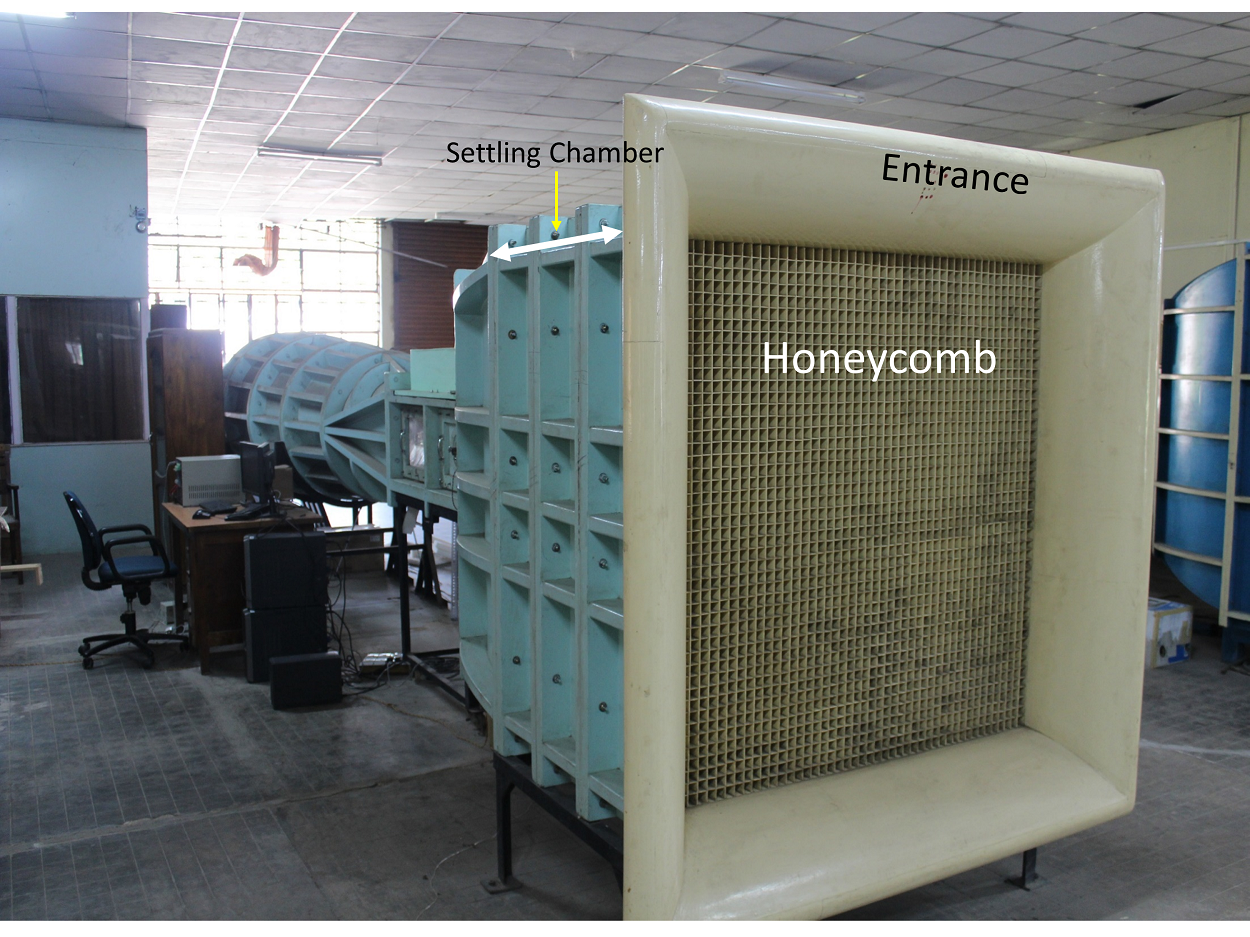
Fig.1 - Windtunnel with Settling chamber, Honeycomb and Entrance highlited
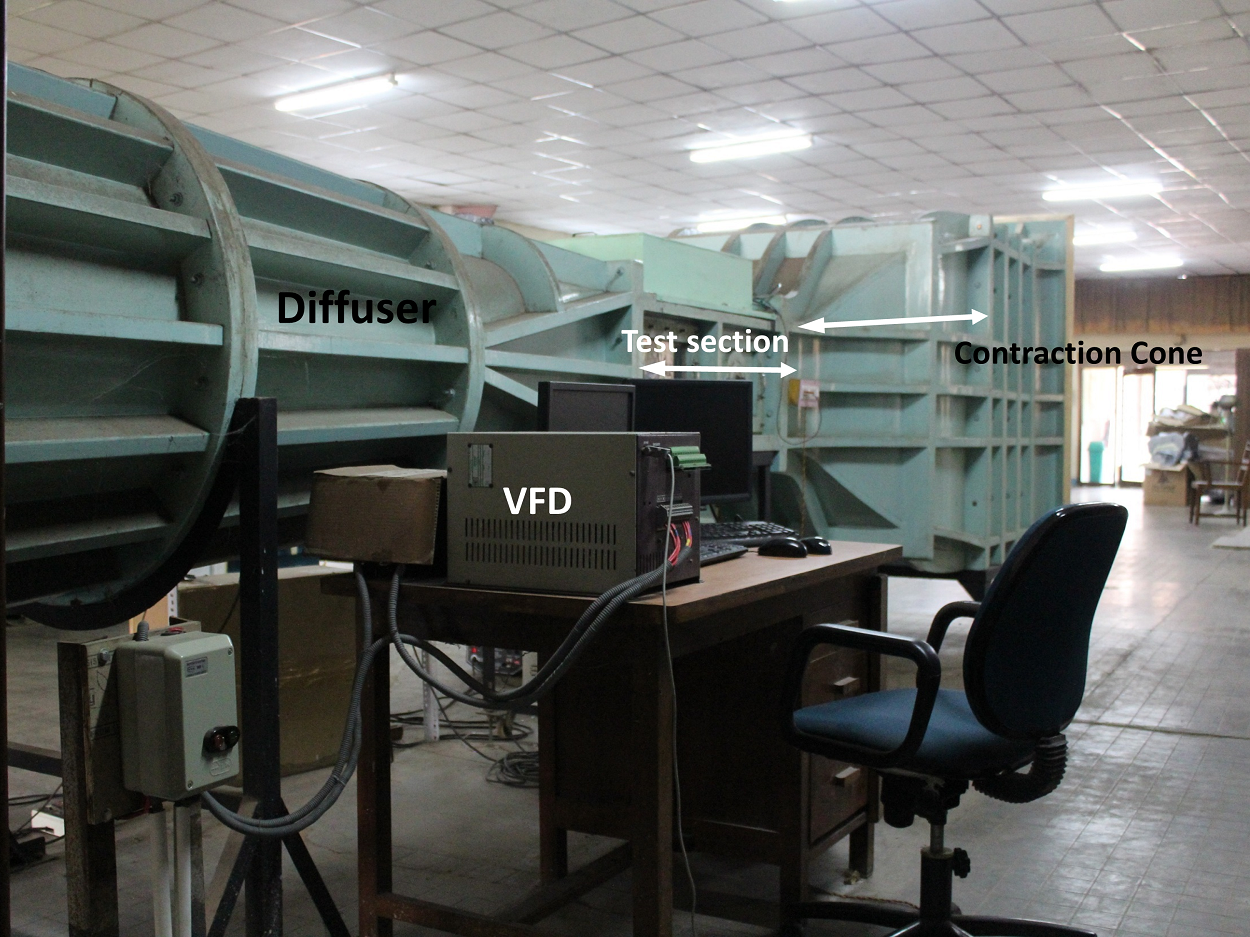
Fig.2 - Windtunnel with Diffuser, Test-section, VFD and Contraction cone highlighted.
An open return, low subsonic, suction-type atmospheric wind tunnel generates the flow in which the model will be mounted. Wind tunnel components are a honeycomb section, a settling chamber, a contraction cone, a test section, a diffuser, a suction fan, and a motor. The air from the atmosphere enters the tunnel through the honeycomb section. Honeycomb reduces the turbulence from the atmosphere by breaking down the disturbances in the flow, due to its structure. The flow then goes through the settling chamber, which has two wire meshes, further reducing incoming turbulence. The settling chamber has a large volume, which further dissipates any disturbances. The contraction cone increases the velocity by reducing the area at the expense of pressure. There are two pressure tappings in the wind tunnel: one at the settling chamber, which gives stagnation or total pressure, and the second at the end of the contraction cone, which gives static pressure. The difference in these two pressures is used to calculate the inlet velocity of the test section. The test section is a constant cross-sectional area where we achieve a one-dimensional, steady, and uniform flow. Models are mounted in this part for the test. Diffuser has two functions: one, it reduces the velocity and increases the pressure leading to the suction fan, which results in less work required by the fan; and two, it provides a gradual decrease in velocity or increase in pressure after the test section, which prevents any flow separation and backflow. The suction fan creates the necessary pressure difference required to maintain the airflow. The fan is run by the motor, which can run at different rpm to create a range of velocities. The rpm of the motor is controlled by a variable frequency drive (VFD).
Circular cylinder
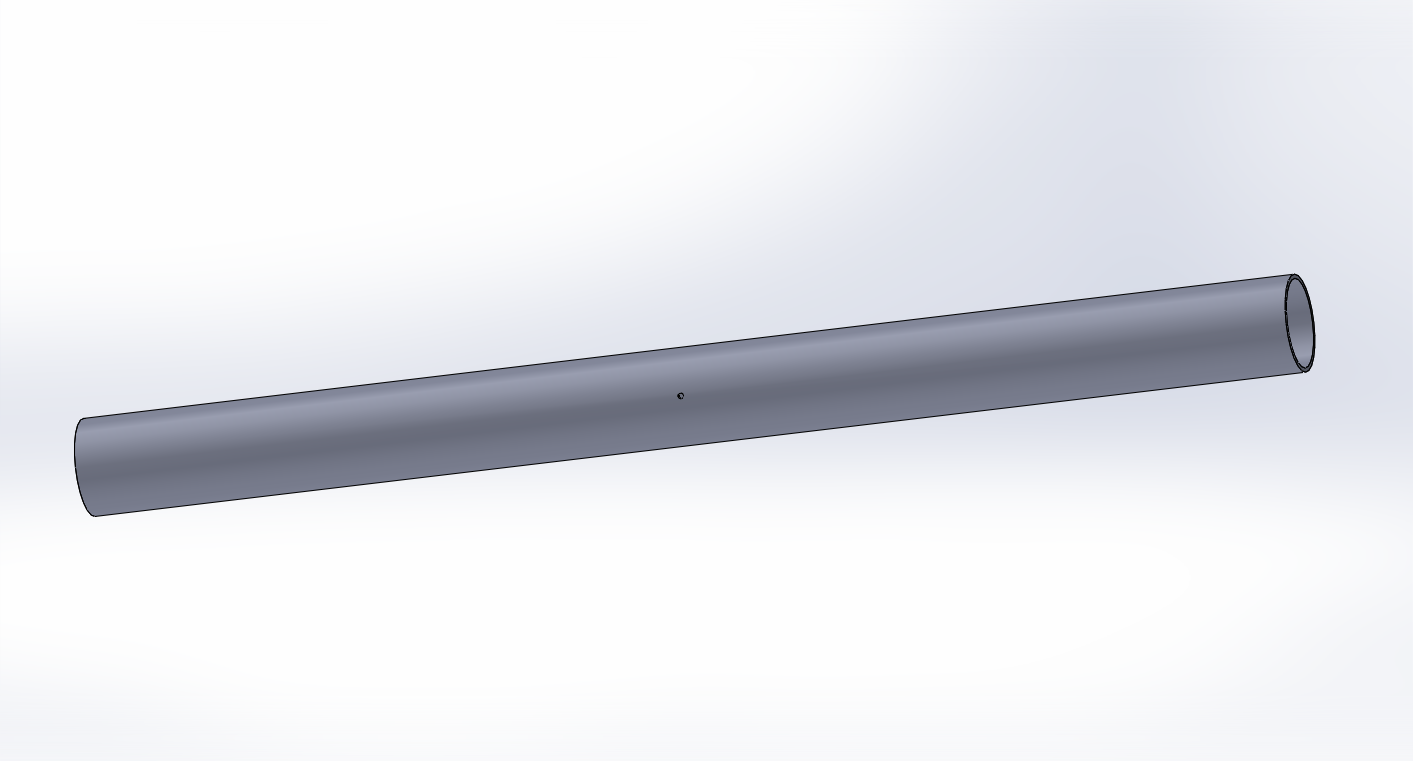
Fig.3 - Cylindrical model used in the experiment.
A circular cylinder of diameter 30 mm is used as the model for this experiment. The cylinder consists of one pressure port. It is placed in the test section and can be rotated at any required angle. The pressure port is connected to the pressure transducer, and the model is rotated to get values at different angles.
Electronic pressure measurement instrument
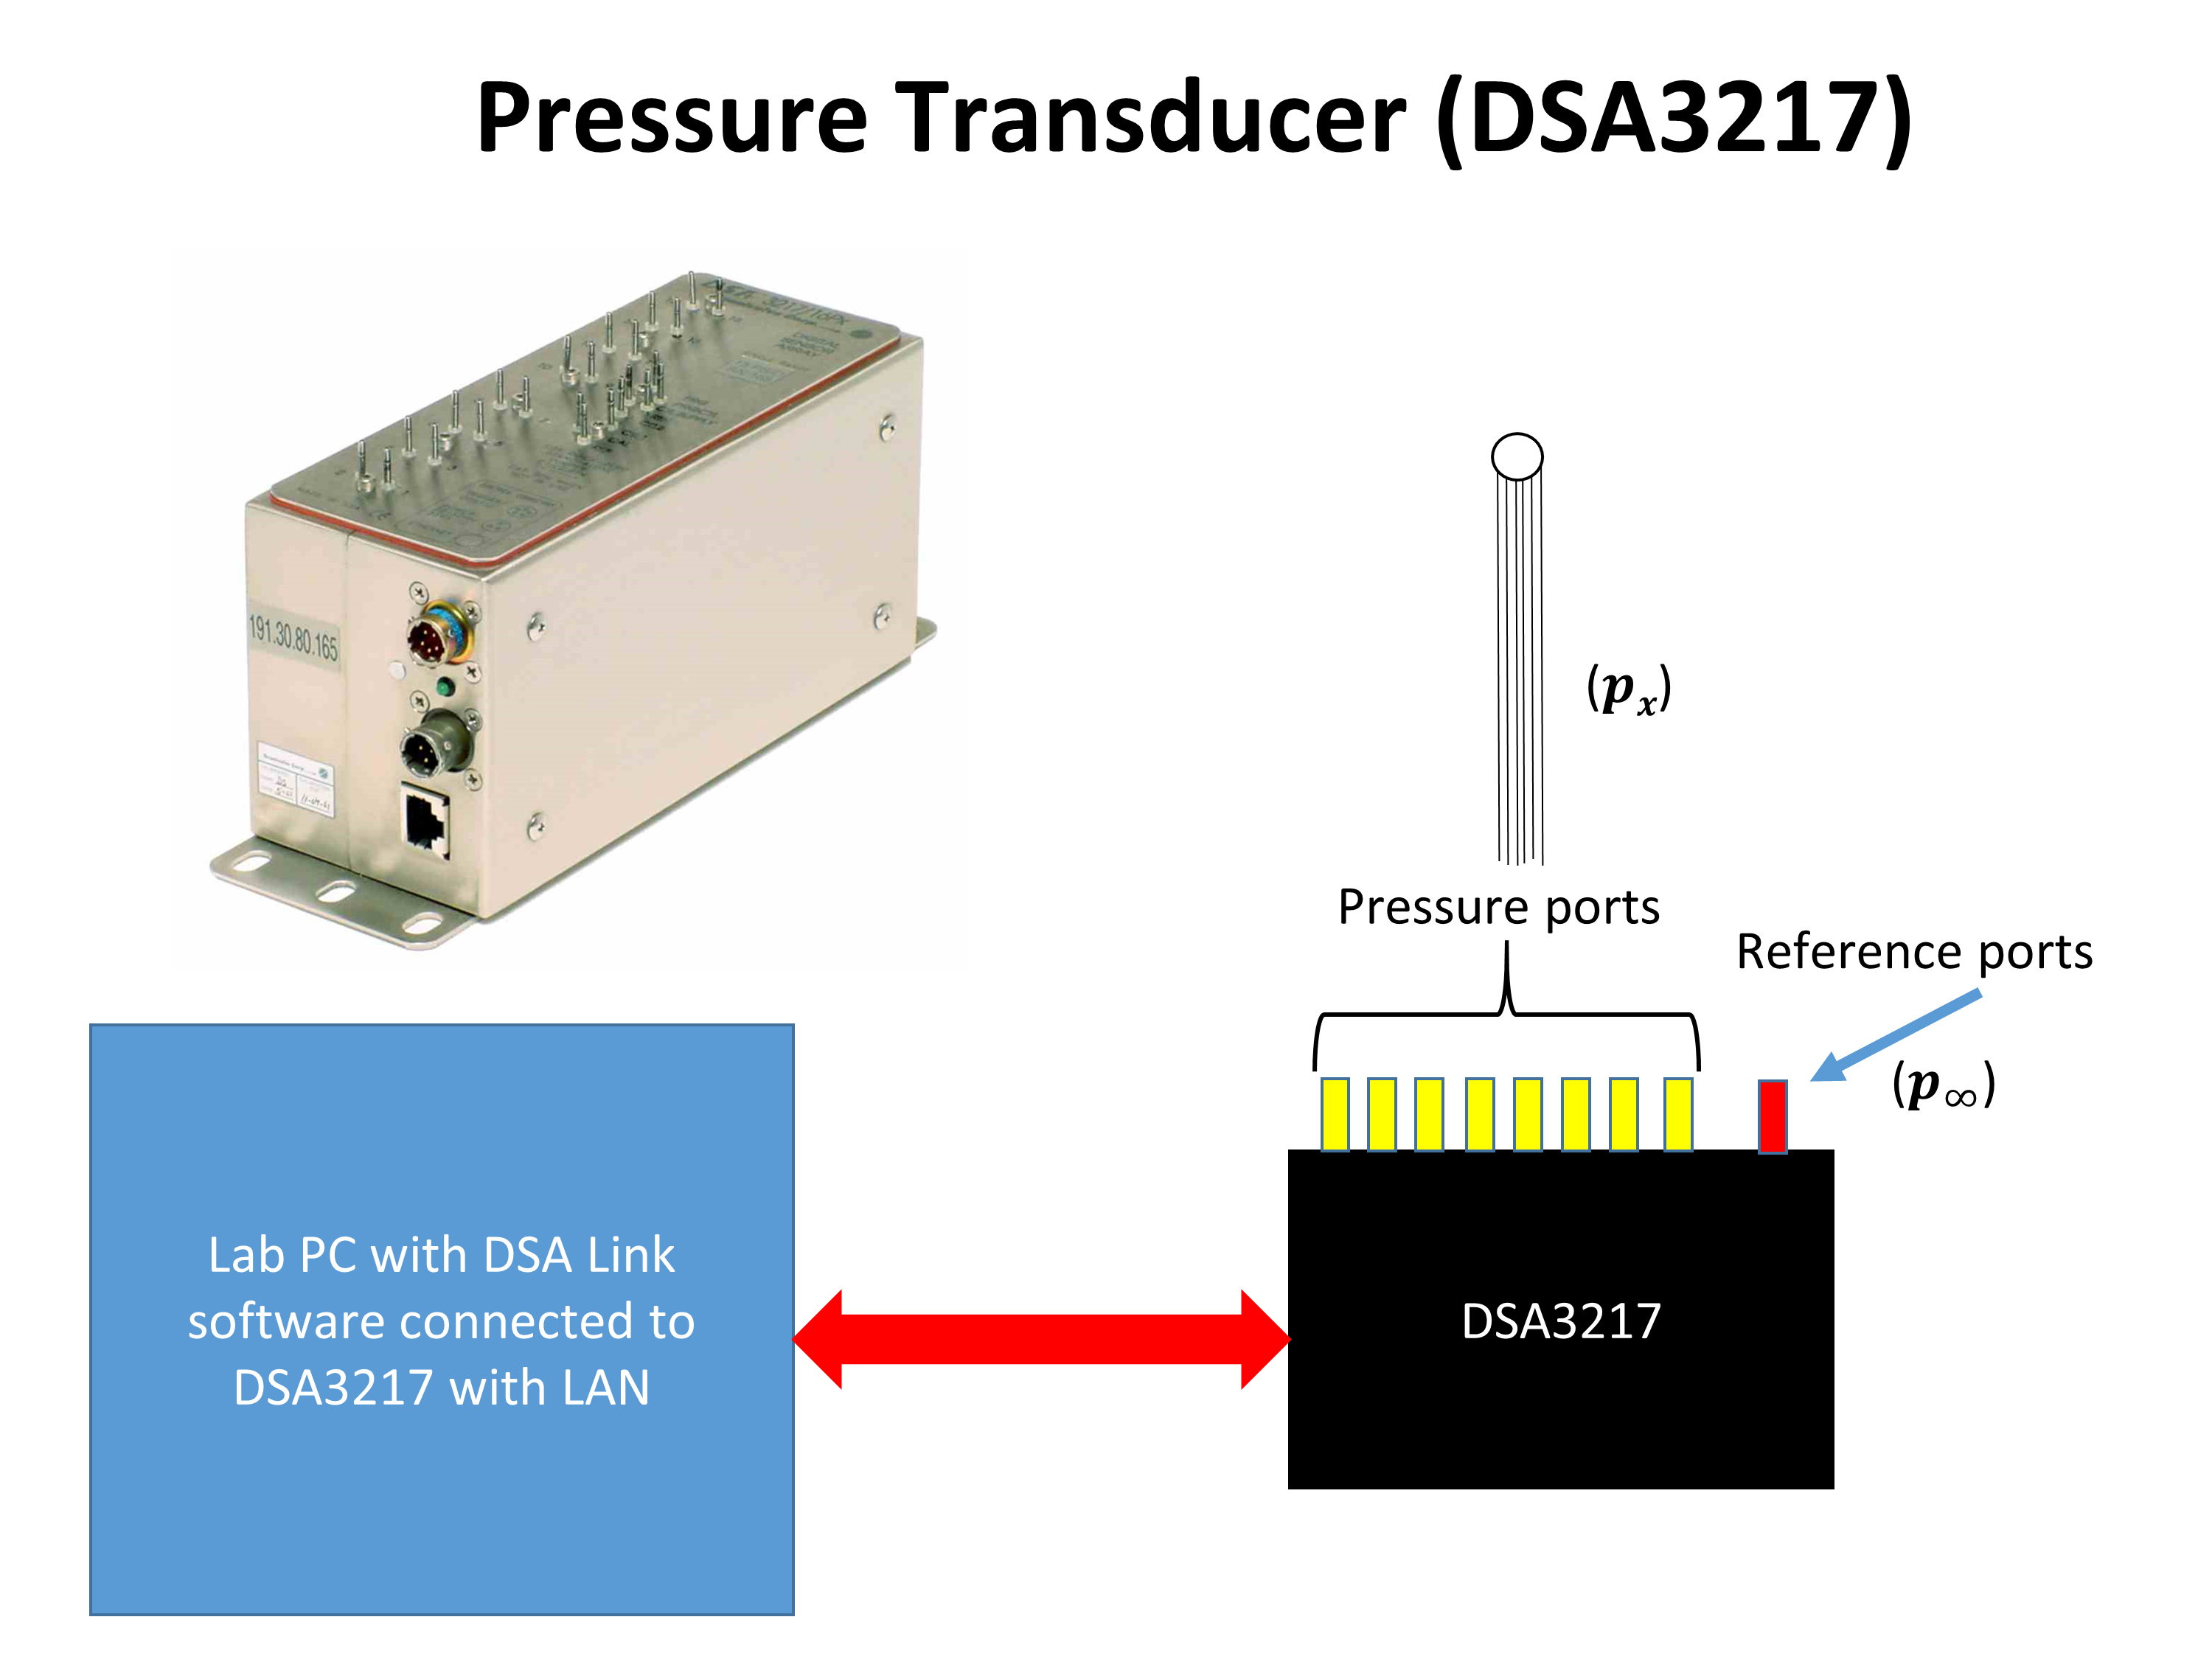
Fig.4 - DSA 3217 alongwith the schematic of the operation.
An electronic pressure measurement instrument is used to measure pressure coming from the cylinder model. Here we have used a Scanivalve made digital sensor array (DSA 3217), which is a differential pressure measurement device; it has 16 temperature-compensated piezoresistive sensors with a pneumatic calibration valve, RAM, 16-bit A/D converter, and a microprocessor in a compact, self-contained module. It outputs pressure values in the user-defined engineering unit directly. We can measure 16 pressures simultaneously using this device. It uses an Ethernet connection for communication with any computer.
Data acquisition system
To operate DSA, a manufacturer-provided software DSALink is required. The software is run using a computer, where a user defines the necessary parameters like data rate, number of samples, and engineering unit. DSA is connected to a computer via Ethernet using TCP/IP protocol.
Experimental procedure
Schematic of the setup:
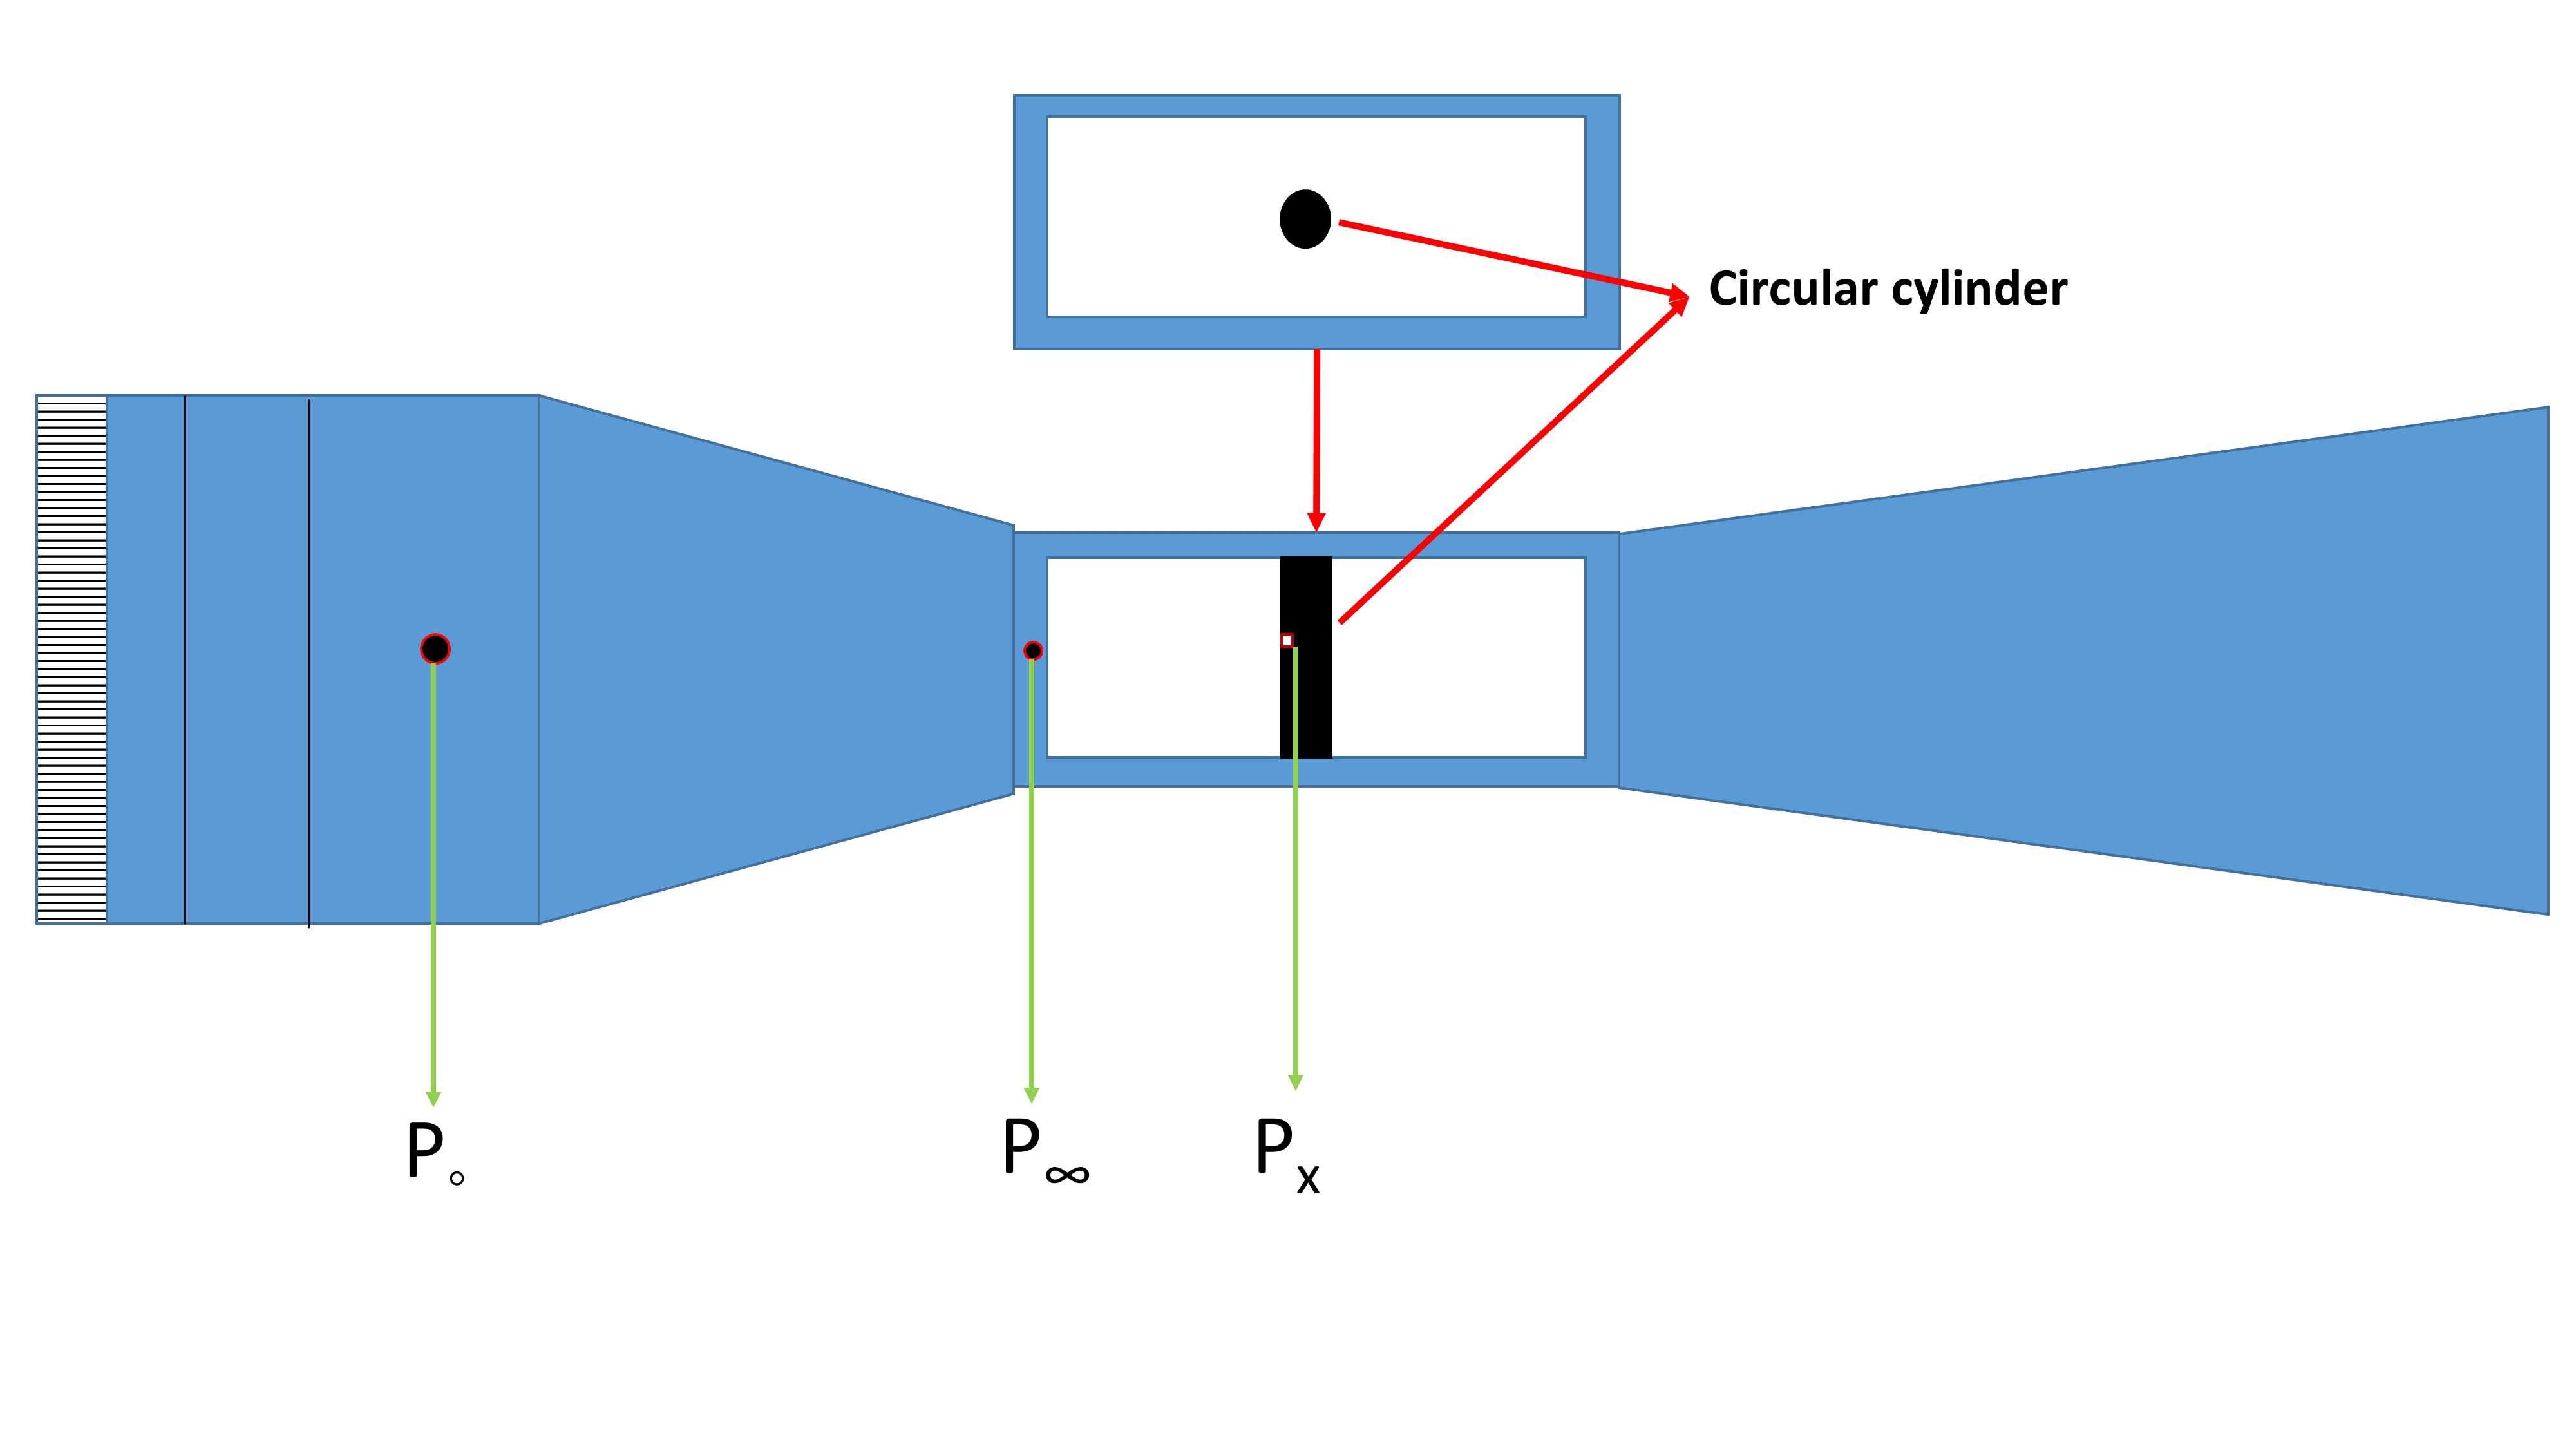
Fig.5 - Schematic of the present experiment.
Steps
Take the dimensions of the circular cylinder.
Fix the circular cylinder in the wind tunnel with the pressure port corresponding to 180o position, i.e., the port facing the freestream flow.
Connect the reference port of the DSA3217 to the pressure port at the inlet of the test section.
Connect the ports on DSA3217 with the circular cylinder using a pneumatic tube. The reading at the connected port is now (PΘ - P∞).
Connect a port on DSA3217 with the pressure port at the settling chamber using a pneumatic tube. The reading at the connected port is now (P0 - P∞).
Zero calibrate the transducer, i.e., check that the output is zero during the no-flow condition.
Set a desired velocity in the wind tunnel using VFD.
Take the pressure measurements for θ values +180o to -180o.
The experiment can be repeated for different velocities to get readings for different Reynolds numbers.
Tabulate all the data and calculate Cp and CD using the equations.
Calculations
- From eq. (3) determine the experimental Coefficient of pressure, which may be called as experimental value
- From eq. (4), determine the theoretical Coefficient of pressure.
- From eq. (5), determine the drag Coefficient.
- Plot a graph for the theoretical and experimental Coefficient of pressure.