
Determination of Planck constant
Procedure to run the simulation :
Click on "ENABLE POWER" button to start the experiment
- This will activate all the circuit components and start the instruction panel
- This will activate all the circuit components and start the instruction panel
Click on "Place LED" button to place an LED on the canvas
- You'll need to click on the canvas area to position the LED
- You'll need to click on the canvas area to position the LED
Click on "Battery" button to place a battery on the canvas
- Position the battery appropriately on the canvas
- Position the battery appropriately on the canvas
Click on "Ammeter" button to place an ammeter on the canvas
- This will measure the current flow through the circuit
- This will measure the current flow through the circuit
Click on "Voltmeter" button to place a voltmeter on the canvas
- This will measure the voltage across the LED
- This will measure the voltage across the LED
Click on "Connect" button to connect the components
- Click on the terminals of the components to create connections
- Connect: Battery (+) → Ammeter → LED (+) → LED (-) → Battery (-)
- Click on the terminals of the components to create connections
Select LED Color from the dropdown menu
- Choose from: Red, Blue, Green, or Yellow
- Choose from: Red, Blue, Green, or Yellow
Click "Click" button next to the color selection
- This will enable the current measurement button
- This will enable the current measurement button
Click "Find Here" button to get the current value
- This will show the current flowing through the LED
- This will show the current flowing through the LED
Use the voltage slider to adjust the voltage
- Slide from 0 to 5V to find the threshold voltage where the LED just starts glowing
- Slide from 0 to 5V to find the threshold voltage where the LED just starts glowing
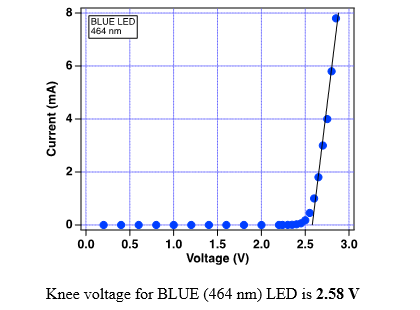
Observe the LED to determine the threshold voltage (V₀)
- Note the voltage at which the LED first emits light
- Note the voltage at which the LED first emits light
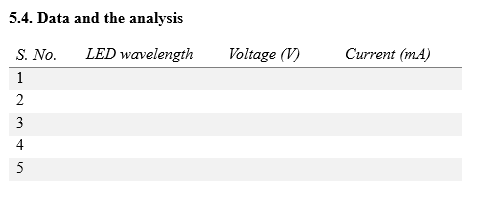
Record the data in the observations table
- Enter the LED color, threshold voltage (V₀), and wavelength (λ) for each color
- Enter the LED color, threshold voltage (V₀), and wavelength (λ) for each color
Repeat steps 2-12 for different LED colors (Red, Yellow, Green, Blue)
Click "Calculate Data" button after entering all observations
- This will calculate 1/λ values for the graph
- This will calculate 1/λ values for the graph
Click "Draw Graph" button to plot the graph
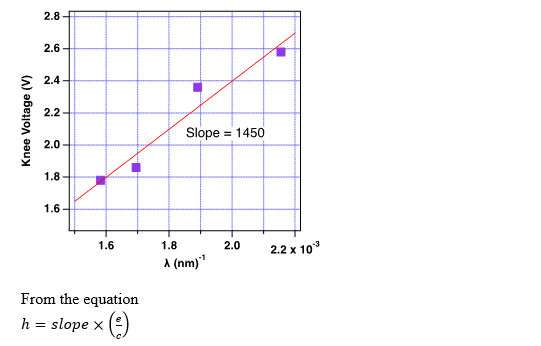
- This will create a graph of V₀ vs 1/λ
- This will create a graph of V₀ vs 1/λ
Enter coordinates in the "Enter First Coordinate" and "Enter Second Coordinate" fields
- Use two points from your graph to calculate the slope
- Use two points from your graph to calculate the slope
Click "Find Slope" button to calculate the slope
- This will give you the slope of the linear plot
- This will give you the slope of the linear plot
Enter the calculated slope in the "Enter Slope" field
Click "Calculate" button to find Planck's constant
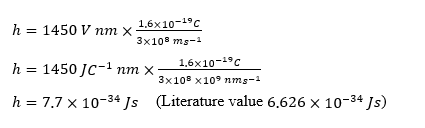
- This will calculate h = (slope × e) / c
- This will calculate h = (slope × e) / c
Procedure in Laboratory :
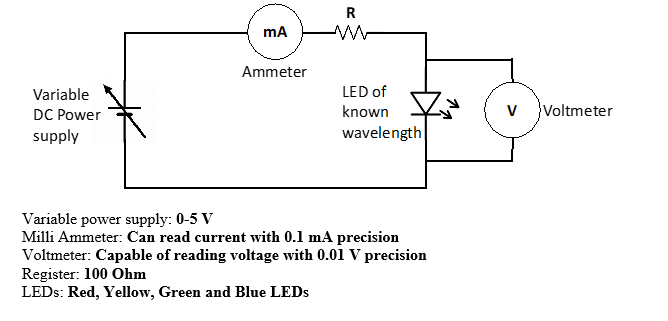
Apparatus :
A. 0-10 V power supply
B. Digital milliammeter
C. Digital voltmeter
D. Known wavelength LED’s (Light-Emitting Diodes).
Procedure in laboratory (diagram)
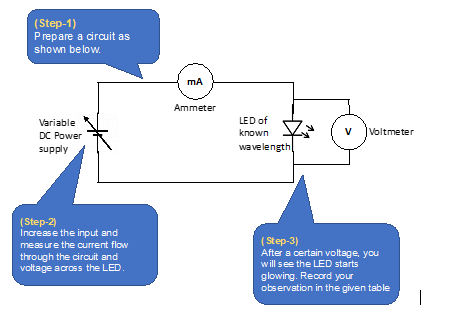
Procedure in laboratory :
Prepare a circuit as per follows

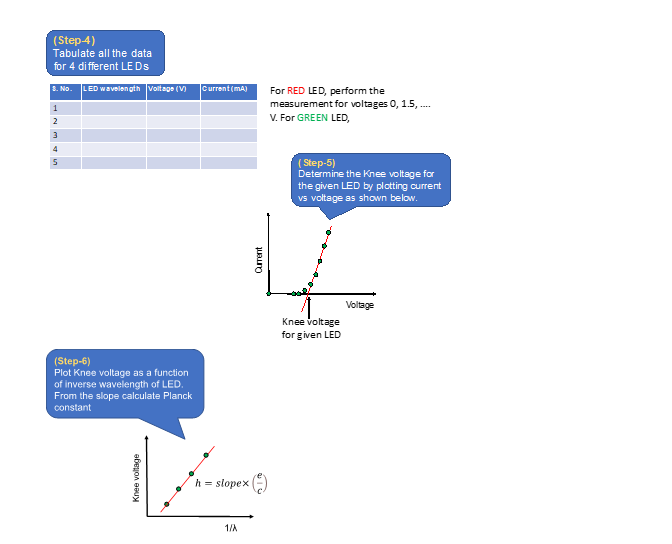
Analysis :
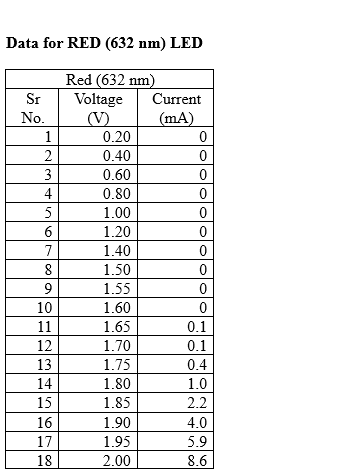
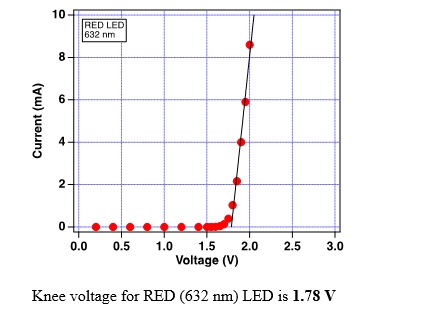
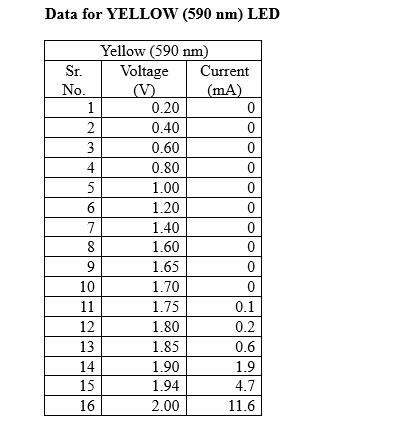
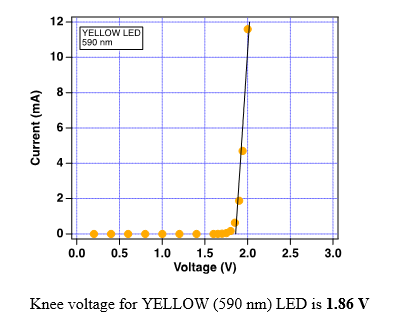
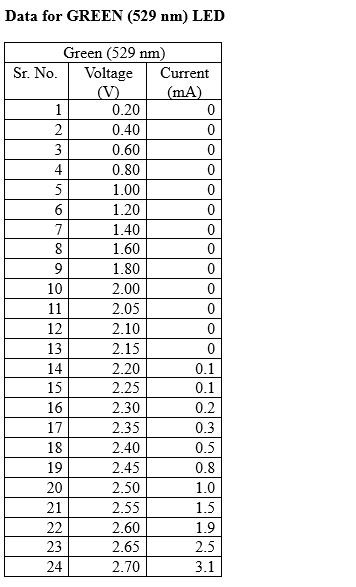
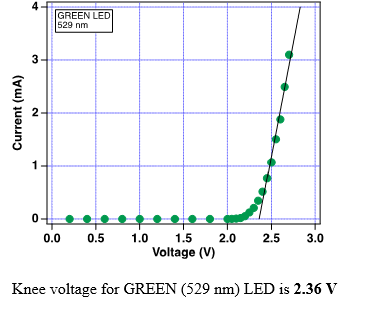
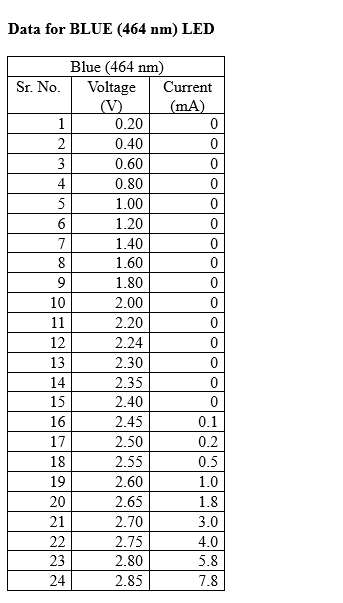
A) Determine the Knee voltage for Red, Yellow, Green and Blue LEDs
B) Note down the wavelengths for Red, Yellow, Green and Blue LEDs
C) Calculate the value of Planck’s constant