Dislocation density measurement in cold rolled metals using XRD and TEM
A. XRD-Based Dislocation Density Measurement
- Collect the diffraction pattern of the cold-rolled metal sample.
- Choose a relevant diffraction peak (e.g., a strong, well-resolved peak) for analysis.
- Determine Peak Broadening
- Measure the peak’s full width at half maximum (FWHM), denoted as β.
- Use appropriate XRD analysis software (e.g., X’Pert HighScore, Jade, or similar).
- Subtract Instrumental Broadening
- Obtain the instrumental FWHM from a strain-free standard sample.
- Subtract this instrumental contribution from β to isolate broadening due to lattice imperfections.
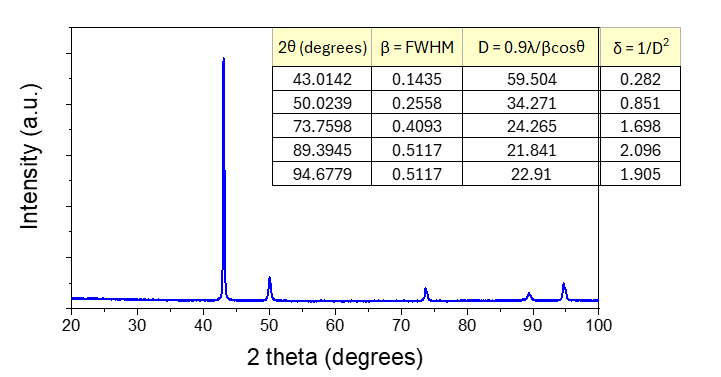
- Calculate the crystallite size using the Scherrer’s formula.
- Calculate the dislocation density from the average crystallite size.
- Perform the above steps on different peaks to verify consistency.
- Average the resulting dislocation density values for a representative result.

Figure 1: X-ray diffractogram for cold rolled metals and computation of dislocation density.
B. TEM-Based Dislocation Density Measurement
- Prepare TEM Sample → Create a thin foil (using techniques like mechanical polishing and ion milling) so electrons can transmit through the sample.
- Acquire TEM Micrographs
- Use bright-field or diffraction-contrast TEM imaging to observe dislocations.
- Adjust imaging conditions (voltage, focus, etc.) to clearly see dislocation lines.
- Measure Dislocations in Images
- Use image analysis software (e.g., ImageJ) to measure either:
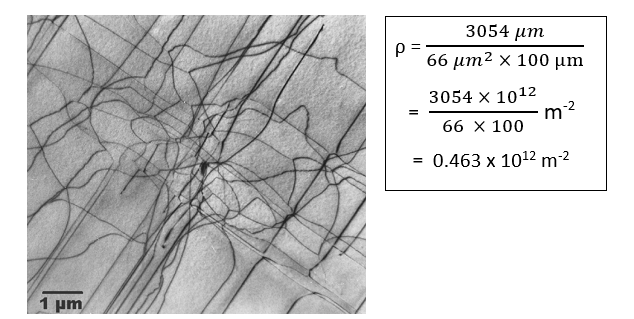
a) The total length of dislocation lines (Lₐ).
b) The number of discrete dislocation segments (N). - Determine Foil Thickness
- Measure or estimate the sample thickness (t) using methods such as convergent beam electron diffraction (CBED) or thickness fringes.
- Calculate Dislocation Density
- Repeat for Multiple Regions
- Collect images from different regions of the sample to ensure statistical validity.
- Average the dislocation densities from all micrographs for a final representative value.

Figure 2: TEM nanograph for cold rolled metal showing dislocations.
