
To study and implement the K-Means Clustering algorithm for similarity-based grouping
Introduction
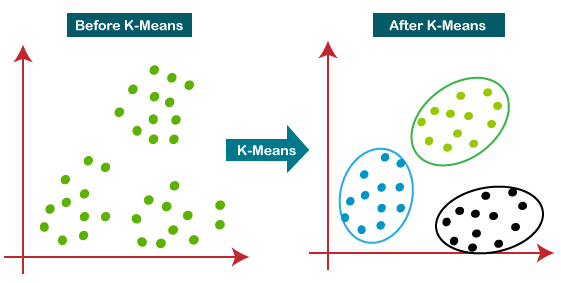
K-means Clustering is a type of unsupervised learning, which is used when you have unlabeled data (i.e., data without defined categories or groups).
K-means Clustering was originally discovered by Polish mathematician Hugo Steinhaus in 1956. The algorithm was independently proposed by several researchers including Lloyd, MacQueen, and Jancey during the 1950s and 1960s.
K-means Clustering is a method of vector quantization that is popular for cluster analysis in data mining.
The goal of this algorithm is to find groups in the data, with the number of groups represented by the variable K. The algorithm works iteratively to assign each data point to one of the K groups based on the features that are provided. Data points are clustered based on feature similarity. Rather than defining groups before looking at the data, clustering allows you to find and analyze the groups that have formed organically. The "Choosing K" section below describes how the number of groups can be determined.
Each centroid of a cluster is a collection of feature values that define the resulting groups. Examining the centroid feature weights can be used to qualitatively interpret what kind of group each cluster represents.
The Κ-means clustering algorithm uses iterative refinement to produce a final result. The algorithm inputs are the number of clusters Κ and the data set. The data set is a collection of features for each data point. The algorithms start with initial estimates for the Κ centroids, which can either be randomly generated or randomly selected from the data set. The algorithm then iterates between two steps:
1. Data assignment step:
Each centroid defines one of the clusters. In this step, each data point is assigned to its nearest centroid, based on the squared Euclidean distance. More formally, if Ci is the collection of centroids in set C, then each data point x is assigned to a cluster based on Euclidean Distance
d =√((X2 - X1)² + (Y2 - Y1)²)
Where,
- d is the Euclidean distance,
- X1 is the x-axis of data point,
- X2 is the x-axis of Centroid,
- Y1 is the y-axis of Data point,
- Y2 is the y-axis of Centroid.
2. Centroid update step:
In this step, the centroids are recomputed. This is done by taking the mean of all data points assigned to that centroid's cluster.
The algorithm iterates between steps one and two until a stopping criterion is met (i.e., no data points change clusters, the sum of the distances is minimized, or some maximum number of iterations is reached).
This algorithm is guaranteed to converge to a result. The result may be a local optimum (i.e. not necessarily the best possible outcome), meaning that assessing more than one run of the algorithm with randomized starting centroids may give a better outcome.
Example
A pizza chain wants to open its delivery centers across a city. To do this, they need to analyze the city's data and find the best locations for their centers. They can use K-means clustering to group the city's data into clusters based on their similarities. For example, they can group the data based on the number of households in each area, the average income of each area, and the distance from each area to the nearest highway. Then they can choose the centers' locations based on the clusters' centroids.
Properties and Features
- It is a centroid-based algorithm.
- It is an unsupervised learning algorithm.
- It is used to solve clustering problems in machine learning or data science.
- It aims to minimize the sum of the squared distance between the data points and the centroids within each cluster.
- It is a simple and frequently used algorithm in data mining and statistics.
The k-means algorithm works as follows:
Select the number of clusters (k) to be created.
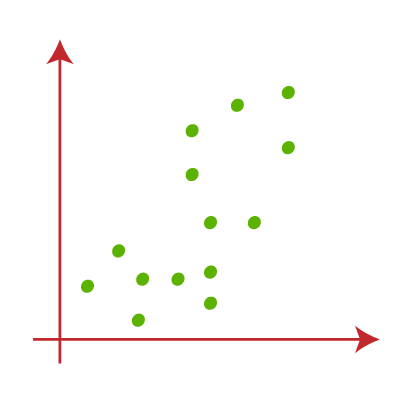
Fig. 2.1 Select the desired number of clusters (k)
Randomly assign each data point to a cluster.
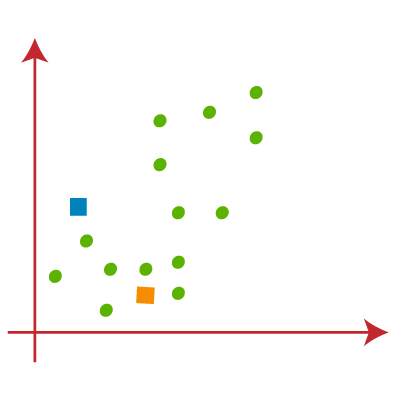
Fig. 2.2 Randomly assign data points to clusters
- Compute the centroid of each cluster.
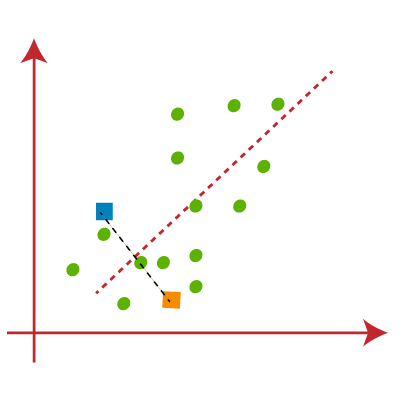
Fig. 2.3 Calculate cluster centroid
Reassign each data point to the cluster whose centroid is closest.
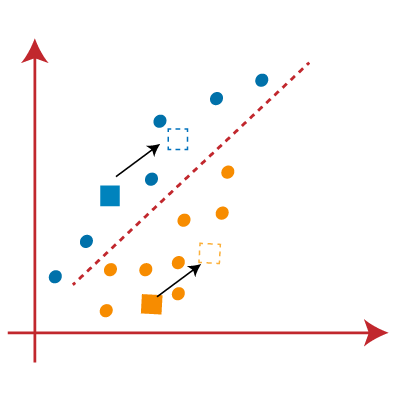
Fig. 2.4 Align data points with nearest cluster's centroid
Repeat steps 3 and 4 until no data points change clusters.
Applications
- Customer Segmentation: Clustering enhances the customer base, targeting areas, and segmenting based on purchase history, interests, or activity monitoring.
- Document Classification: K-means algorithm classifies documents based on tags, topics, and content using vector processing and clustering.
- Identifying crime localities: Data on crimes in specific localities provides valuable insights into crime-prone areas and their categories.
- Delivery store optimization: Optimize truck drone delivery using k-means and genetic algorithms for optimal launch locations and route optimization.
- Ride-share data analysis: Uber ride information dataset offers valuable insights into traffic patterns, transit time, and peak pickup locations for future city planning.
- Call record detail analysis: Call detail record captures customer information, including calls, messages, and internet activity, providing insights into customer needs using demographics and K-means clustering algorithm.
- Insurance fraud detection: Machine learning is crucial for fraud detection in automobile, healthcare, and insurance, identifying clusters of fraudulent patterns and is essential for preventing multi-million-dollar impacts on companies.
- Cyber-Profiling criminals: Cyber-profiling involves collecting data from individuals and groups to identify significant co-relations, derived from criminal profiles, to classify criminals and users in specific environments.
- Automatic clustering of IT alerts: Enterprise IT infrastructure technology generates large volumes of alert messages, requiring manual screening for prioritization and clustering for better analysis and failure prediction.
- K-means Clustering: is used for image segmentation, grouping similar pixels and creating clusters. It can also be used in recommendation engines, like music streaming applications, to group similar types or genres based on user patterns.
Advantages
- It is very easy to understand and implement.
- If we have a large number of variables, then K-means would be faster than Hierarchical clustering.
- On re-computation of centroids, an instance can change the cluster.
- Tighter clusters are formed with K-means as compared to Hierarchical clustering.
- K-means Clustering can be used on unlabeled data sets.
- K-means Clustering can be used on non-linearly separable data.
- The K-means Clustering algorithm is simple and fast.
Disadvantages
- The number of clusters has to be defined beforehand.
- It is sensitive to initial conditions.
- It is not suitable for all types of data.
Conclusion
K-means Clustering is a popular unsupervised learning algorithm that is used to group observations with similar characteristics. It is widely used in various fields such as data mining, machine learning, and image processing. The algorithm is simple and easy to implement, but it has some limitations such as the need to specify the number of clusters in advance and the sensitivity to initial conditions. Despite these limitations, K-means Clustering remains a powerful tool for data analysis and pattern recognition.