
To study and verify the Kirchhoff's law.
Steps to perform Kirchhoff's Voltage Law
STEP 1 : Make connections by dragging nodes from apparatus to the circuit.
(a) Connect power supply to the circuit (1-9, 2-10).
(b) Connect voltmeter (3-11, 4-12) and (5-13, 6-14) and (7-15, 8-16) or you can connect any voltmeter to any resistance in circuit.
(c) Click on the label to delete all the connections for the corresponding nodes.
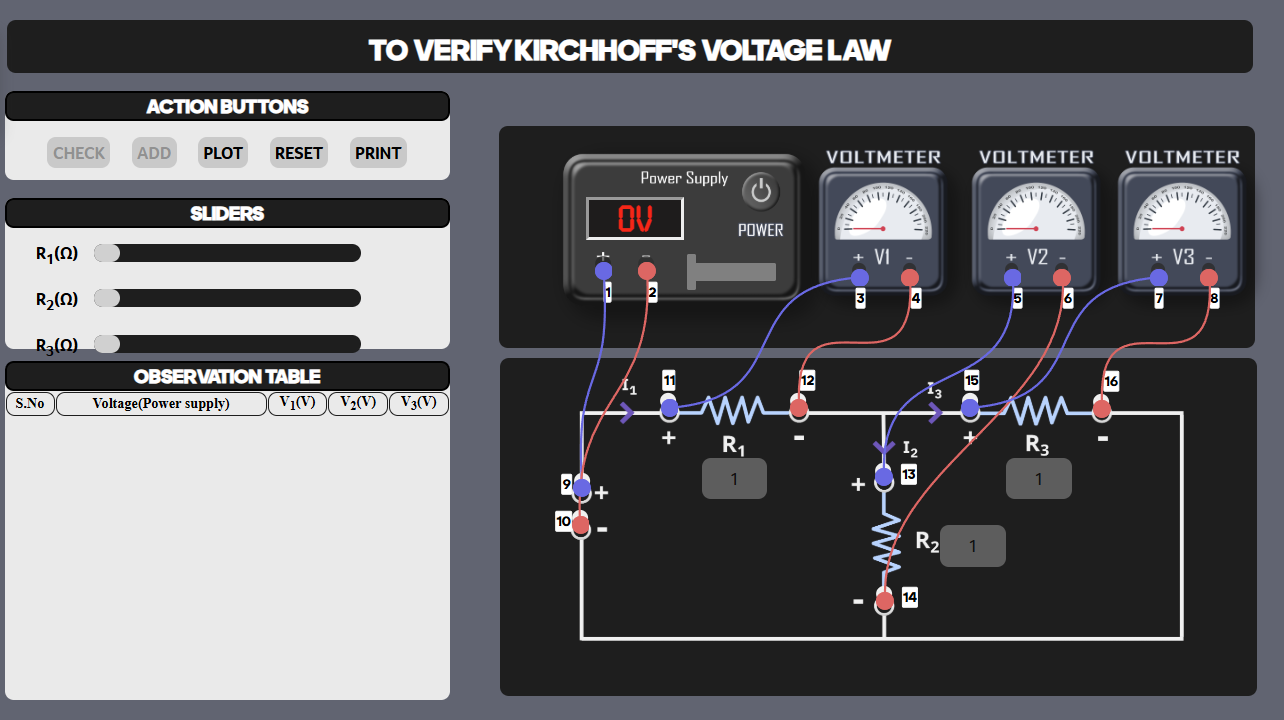
STEP 2 : Check your connections by clicking on the ‘CHECK’ button.
STEP 3 : Set the values of resistances R1, R2 & R3 by adjusting the sliders on left, these values will remain constant throughout the experiment.
STEP 4 : Click the ‘Power’ button to turn on the power supply.
STEP 5 : Now, vary the voltage value by moving the voltage slider to the right side, the readings on the voltmeter will change accordingly.
STEP 6 : Click on the ‘ADD’ button to add the readings to the observation table.
STEP 7 : Repeat steps 6 and 7 until we reach to the 6th reading (Minimum reading to be taken to plot the graph is 6).
STEP 8 : Click on the ‘PLOT’ button to display the graph.
STEP 9 : Click on ‘PRINT’ button to take out the print of the page.
STEP 10 : Click on ‘RESET’ button to refresh the page.
Steps to perform Kirchhoff's Current Law
STEP 1 : Make connections by dragging nodes from apparatus to the circuit.
(a) Connect power supply to the circuit (1-9, 2-10).
(b) Connect ammeters (3-11, 4-12) and (5-13, 6-14) and (7-15, 8-16) or you can connect any ammeter to any resistance in circuit.
(c) Click on the label to delete all the connections for the corresponding nodes.
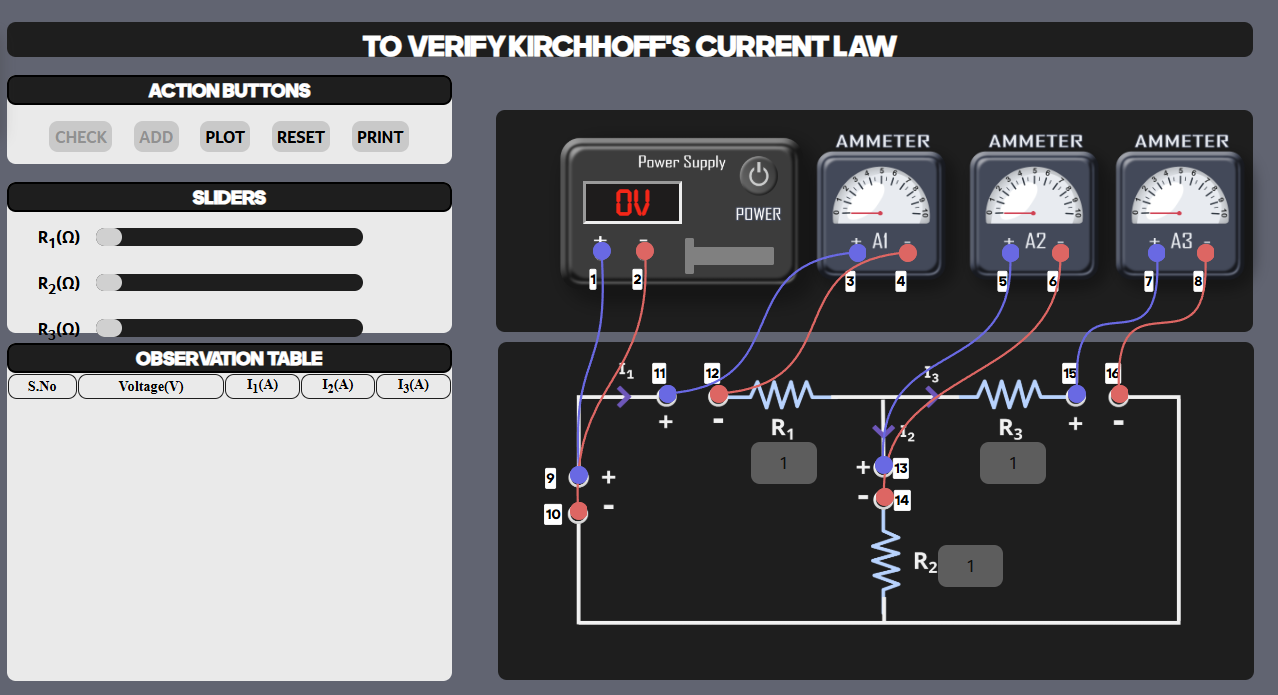
STEP 2 : Check your connections by clicking on the ‘CHECK’ button.
STEP 3 : Set the values of resistances R1, R2 & R3 by adjusting the sliders on left, these values will remain constant throughout the experiment.
STEP 4 : Click the ‘Power’ button to turn on the power supply.
STEP 5 : Now, vary the voltage value by moving the voltage slider to the right side, the readings on the ammeter will change accordingly.
STEP 6 : Click on the ‘ADD’ button to add the readings to the observation table.
STEP 7 : Repeat steps 6 and 7 until we reach to the 6th reading (Minimum reading to be taken to plot the graph is 6).
STEP 8 : Click on the ‘PLOT’ button to display the graph.
STEP 9 : Click on ‘PRINT’ button to take out the print of the page.
STEP 10: Click on ‘RESET’ button to refresh the page.