Heat flow across the weld bead 
Introduction
Heat flow study is essential for welding applications to help us understand the importance of heat on the parent material and the welded joint. Heat flow in welding is primarily caused by heat input from the welding source in a specific zone. The added heat dissipates into the body of the parent material by thermal conduction. Usually, the heat source is able to melt the parent materials and the filler metal which solidifies and forms the welded joint.
Despite the source's net energy is conducted to the parent material as heat, some of the heat is used to melt the metal and produce the weld. Some of heat is carried away from the deposition point, increasing the temperature of the material surrounding the fusion zone and producing undesirable metallurgical and geometrical changes. This zone where these changes take place is known as heat-affected zone. One of the most important aspects of welded joints is heat-affected zone in which microstructural changes takes place but melting of the workpiece doesn’t take place in this zone.
Heat flow and temperature distribution analysis in welding has a vital part in understanding both the metallurgical and mechanical behaviour of welding joints. The rapid cooling rate experienced during welding causes various desired or undesired metallurgical changes. The non-uniform temperature field produced around the weld results in thermal stresses, plastic flow, consequential locked-up residual stresses, and distortion.
During welding, the net heat input Hnet is calculated using the relationship shown below:
$$ H_{net} = \frac{\eta VI}{S} $$
Where,
V =Voltage,
I=Current,
S=Welding speed (mm/s),
η = fraction of heat generated and conducted to the plate.
Theory
Thermal cycle of welding:
Thermal variation
The temperature of the weld varies from the ambient temperature to greater than the melting point temperature. Thus there exists a thermal variation across the weld bead.
The severity of this thermal variation depends on:
- Temperature reached by the workpiece.
- Time required to reach the temperature.
- Hold time at the temperature.
The effect of thermal variation on the structure is completely determined by the above-mentioned points i.e., the thermal variation leads to changes in microstructural characteristics and distortion.
We require the temperature distribution in time and space coordinates in order to mathematically define the thermal cycle.
Welding thermal cycle by using thermocouples
In order to find the thermal cycle undergone by a weld bead, experiment can be performed such that thermocouples are positioned along the weld path at various points. The thermocouples placed along the weld line in A1, A2, A3, A4, and A5 positions can be seen schematically in Figure 1a.
The temperature reading by the thermocouple is plotted and it is observed that while the heat source moves along the path of the weld, the temperature rapidly rises to a peak. The peak temperature is held for a very short time, followed by a temperature drop once the heat source passed by the thermocouple. This variation in the temperature can be seen clearly in the graph shown below Figure 1b.
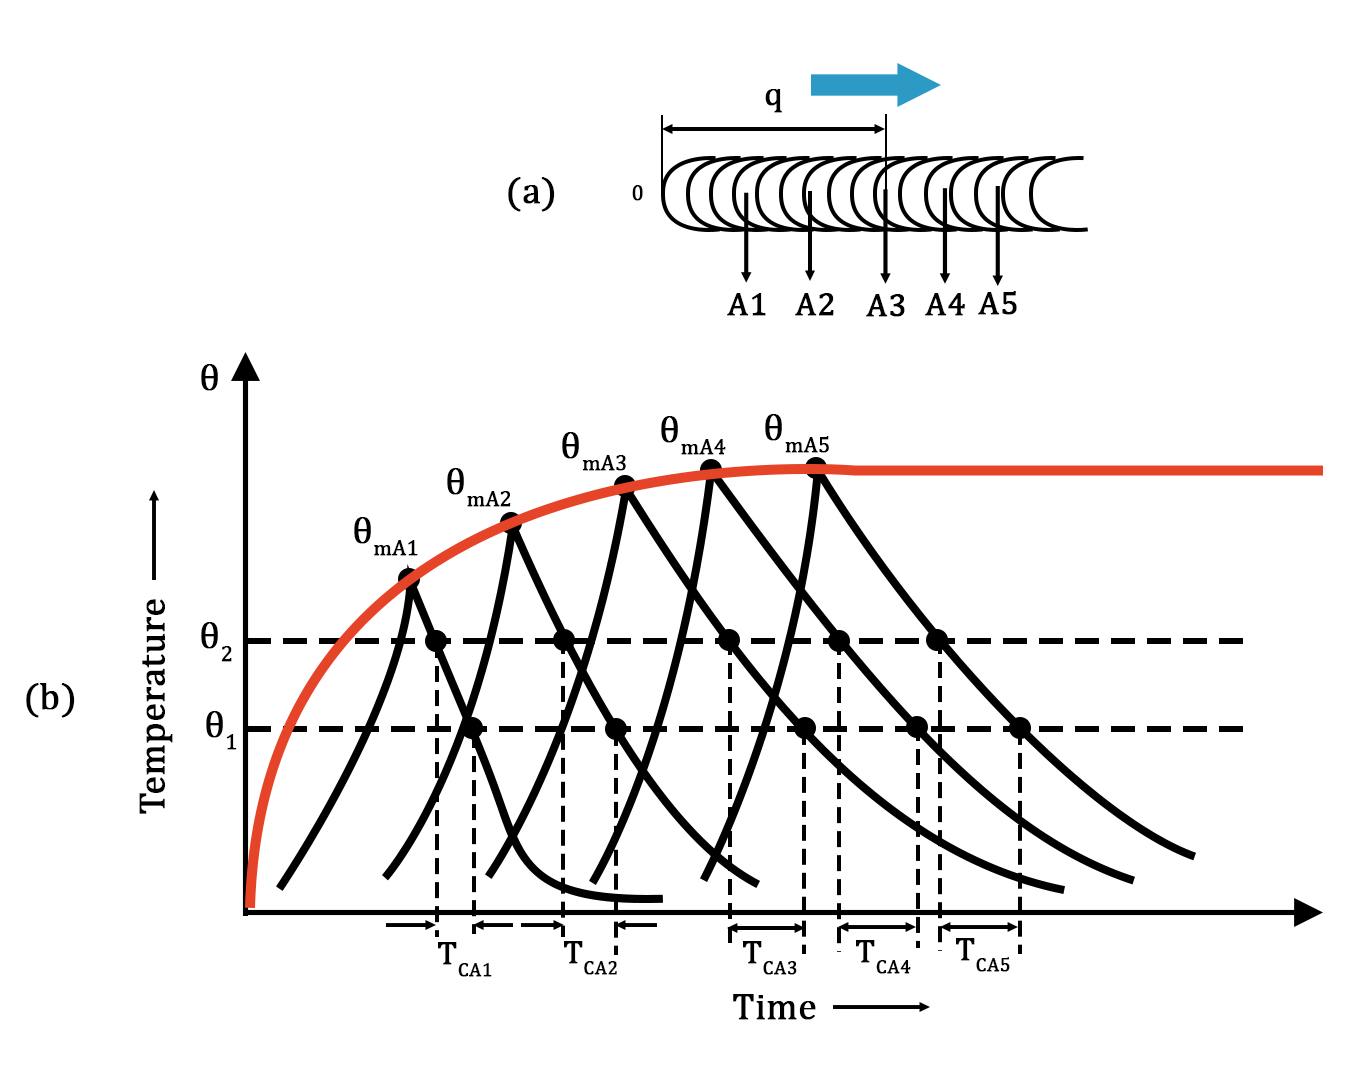
Figure 1(a) Positioning of thermocouples along the operating heat source
1(b) Thermal variation created at each point
The maximum temperature and the remaining thermal cycle reach a quasi-steady state shortly following the start of heat deposition from the source. This is shown by the red curve joining the peak temperature for all thermocouples.
Quasi-steady state is a state in which the rate of heat generated is balanced by the rate of heat dissipated. When a heat source is moving, the temperature isotherms surrounding it remain constant and appear to move with it (away from edges). The isotherms follow an elliptical shape when observed from the top, as can be seen in Figure 2.
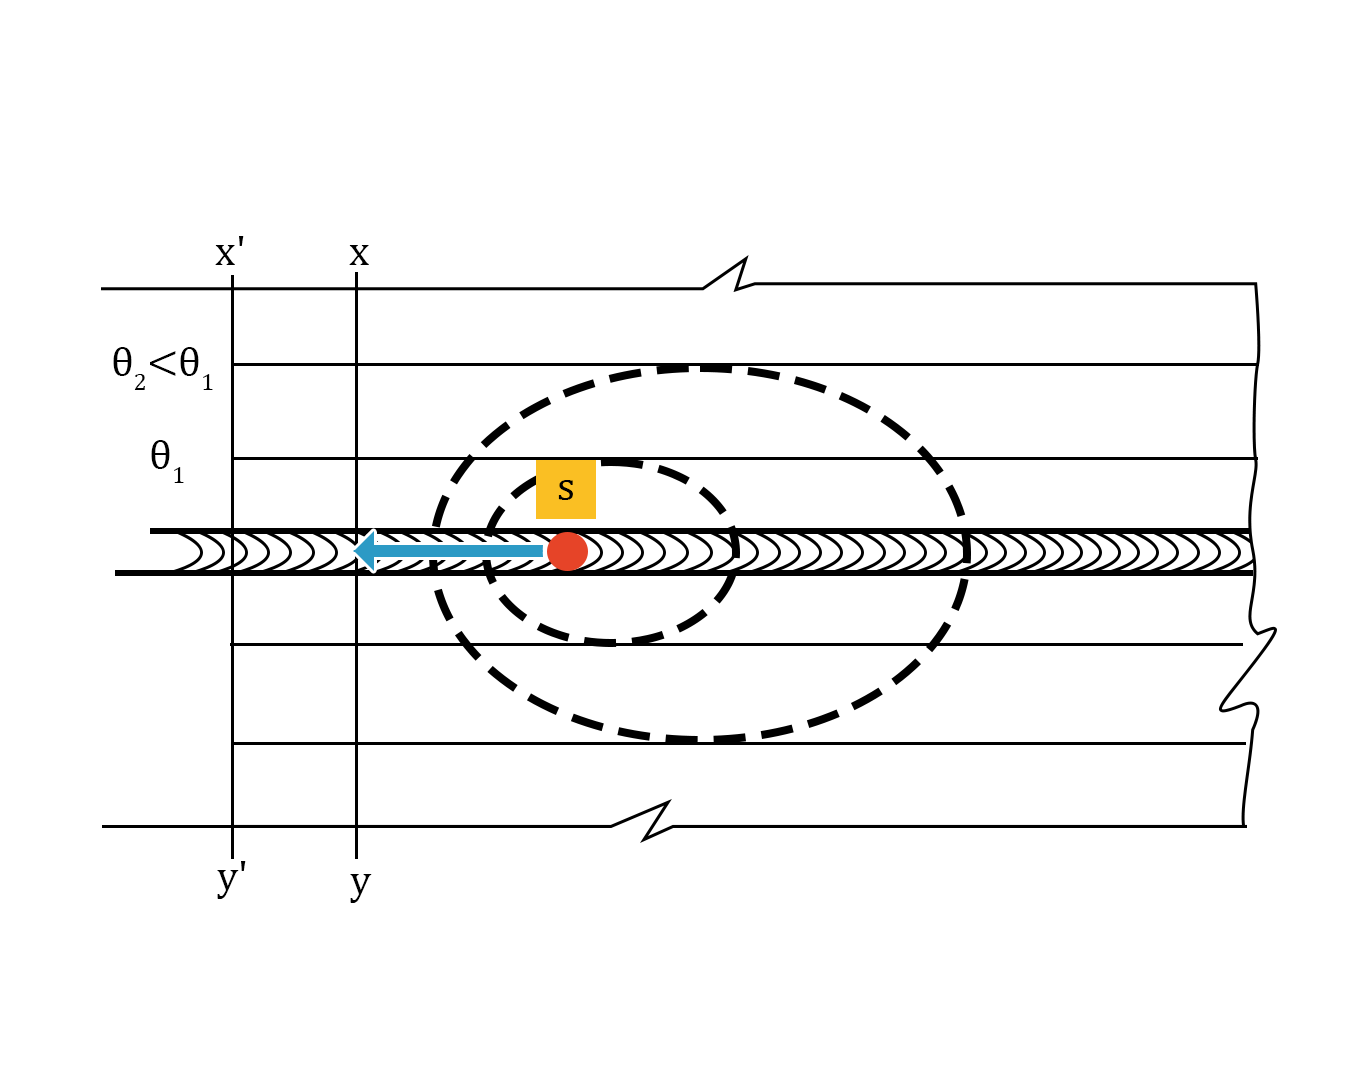
Figure 2. Diagram illustrating the development of a quasi-steady state condition in a moving heat source weld over the course of some time
Time-Temperature curves
Time-Temperature curves can be achieved by placing thermocouples at various equidistant points perpendicular to the direction of weld. The positions of the thermocouple are denoted by points P, Q, R as can be seen in Figure 3. While performing the experiment, as the heat source moves along the weld line, thermocouples will record temperature at each point with respect to time, thus obtaining Time-Temperature curves as shown in Figure 3.
The following observations can be seen from the Time-Temperature curves.
- Peak temperature will decrease by increasing the distance from the heat source.
- The highest temperatures reached \( \theta_{mP}, \theta_{mQ}, \theta_{mR} \) decreases with increasing distance from the weld centre line as a function of time \( T_{mP}, T_{mQ}, T_{mR} \). Plotting the peak temperature \( \theta_{mP} \) as a function of time is shown in Figure 3.
- The maximum temperature separates the heating phase from the cooling phase of the welding thermal cycle. At a certain interval of time, when points near the weld start cooling, points more distant continue to heat. This occurrence describes certain features of heat-affected zone transformation of phases, differential rate of thermal expansion and contraction which will carry to distortion and thermal stresses.
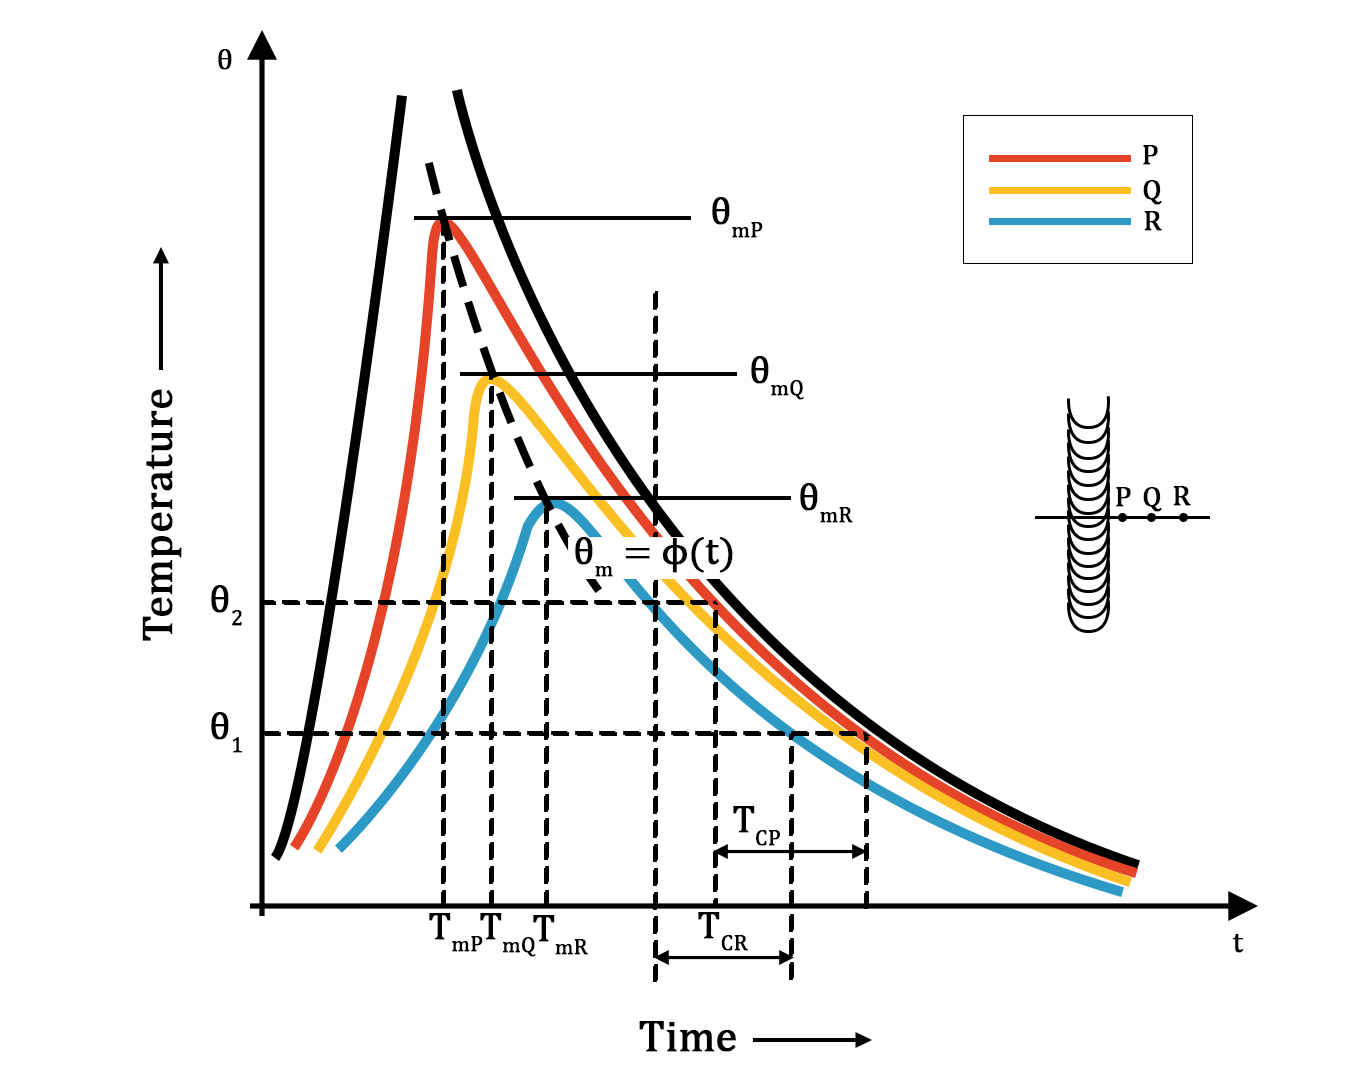
Figure 3. Time-Temperature curves for a moving weld heat source
Spatial isotherms
Peak temperature separates the heating & cooling zone. Peak temperature will determine the cooling rate. Points closer to peak temperature will cool fast and the points further away from the peak temperature will cool slow. Peak temperature is very important for metallurgical changes in the material.
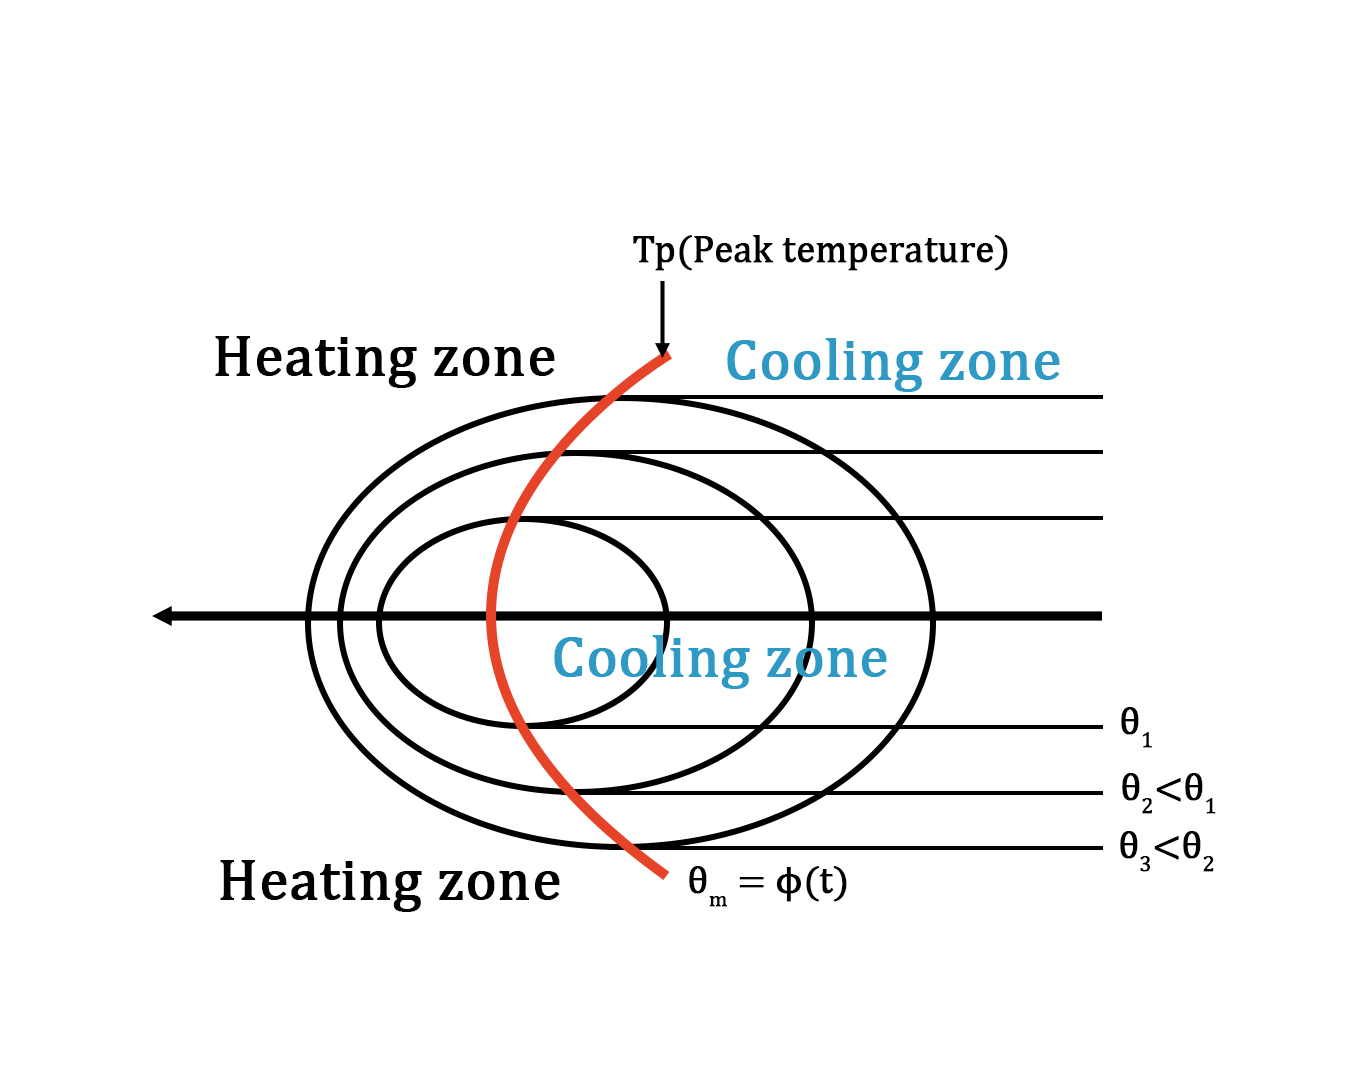
Figure 4. Temperature isotherms near the weld zone
The generalized heat flow equation:
An elaborate theoretical analysis of heat flow in welding is carried out using the basic equation of heat flow by conduction in three dimensions. It was originally observed by Rosenthal that the nature of the temperature field in arc welding is quasi-stationary. It means that although the temperature at a point on the plate is changing with time if we consider the temperature isotherms remain stationary i.e., the shape of the temperature field around the arc will be the same whatever its position be. This aspect is shown in Figure 2. The theoretical analysis involves rewriting this equation of heat conduction in a moving coordinate system with the arc centre as the origin. Suitable boundary conditions for cases of thin or thick plates are imposed and a solution is obtained. Temperature does not vary along the thickness for thin plates i.e., it is two-dimensional distribution while it varies along the thickness in the case of thick plates. However, at points somewhat away from the arc, the temperature field becomes two-dimensional even for moderately thick plates.
Temperature distribution along a section parallel to the weld shows a steep rise in the beginning and then gradual cooling. The peak temperature which is attained at a particular section plays an important role in deciding whether there will be metallurgical microstructural changes along this section (i.e., the size of the head affected). This information is useful in the calculation of residual stresses and distortion. For two-dimensional case, the peak temperature over a particular transverse section is given by the above analysis by using simplified Rosenthal's equation,
$$ \frac{1}{T_p-T_o}=\frac{4.132 * C * \rho * t * x}{H_{net}}+\frac{1}{T_m-T_o} $$
Where,
\( T_p \) = Peak temperature (K)
\( T_o \)= Ambient temperature of the workpiece (K)
\( \rho \) = density of the workpiece (g/mm3)
\( C \) = specific heat of the workpiece (J/g K -1)
\( t \) = workpiece thickness (mm)
\( x \) = distance from weld centre line (mm)
\( T_m \)= Melting temperature of the workpiece (K)
\( H_{net} = \frac{q}{v} \) in (J/m)
Where,
\( q \)= heat or energy (J/s)
\( v \)= Welding speed (m/s)
Peak temperature can be calculated by the above equation and the peak temperature distribution throughout the weld-centre line governs
- Weld pool shape.
- Heat affected zone size.
- Type of metallurgical transformation.
- Mechanical properties of weld and HAZ.
Thus it is very important to understand the heat flow in welding and peak temperature distribution in welding.
