
V-I Characteristics of Gunn Diode.
Procedure
To perform the experiment follow the steps:
Step-1: Click on Components button for components to pop up.
Step-2: Click on the "Components", drag them to the test bench and place them as shown in fig. 1.
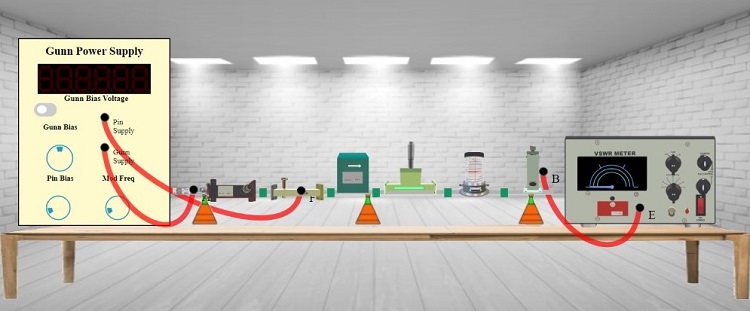
Fig. 1 Bench setup for V-I Characteristics of Gunn Diode
Step-3: After placing the components on the test bench, connect the wires accordingly.
Step-4: If your connections are correct then you may continue to take down the readings, if not then click on "Reset Button" and try it again.
Step-5: Move the "Gunn Bias" knob and set it to 0.5 or above to record your readings.
Step-6: Toggle the switch button to get the value of Gunn Diode Current.
Step-7: Click on Add to table to take down the values of Gunn Bias Voltage and Gunn Diode Current.
Step-8: Toggle the switch button again for Gunn Bias Voltage and move the "Gunn Bias" knob for different reading.
Step-9: Repeat the process for almost 7 different readings as you did for the first reading.
Step-10: Click on "Plot" button to plot a graph as per your readings.
Step-11: If you want to save the graph click on the camera icon just above the graph.
Step-12: If you want to take down more readings, then click on "Close" Button.
Step-13: And repeat the same process to take down the readings as you did for the first reading.
Step-14: Click on "Print" button to print your current page (readings and connections) or to save your page (readings and connections) in a PDF form. After clicking on "Print Button" set the layout as "Landscape" to get a proper view of the page then go to more settings and click on the checkbox named "Background graphics".