
Carrier Dynamics in Energy Wavevector Space
In crystalline solids, the motion of charge carriers can be conveniently described using the relationship between their energy (E) and wavevector (k), commonly depicted in the E–k diagram.
This approach helps determine important physical parameters such as group velocity, momentum, effective mass, and the energy band gap, all of which are crucial in semiconductor physics.
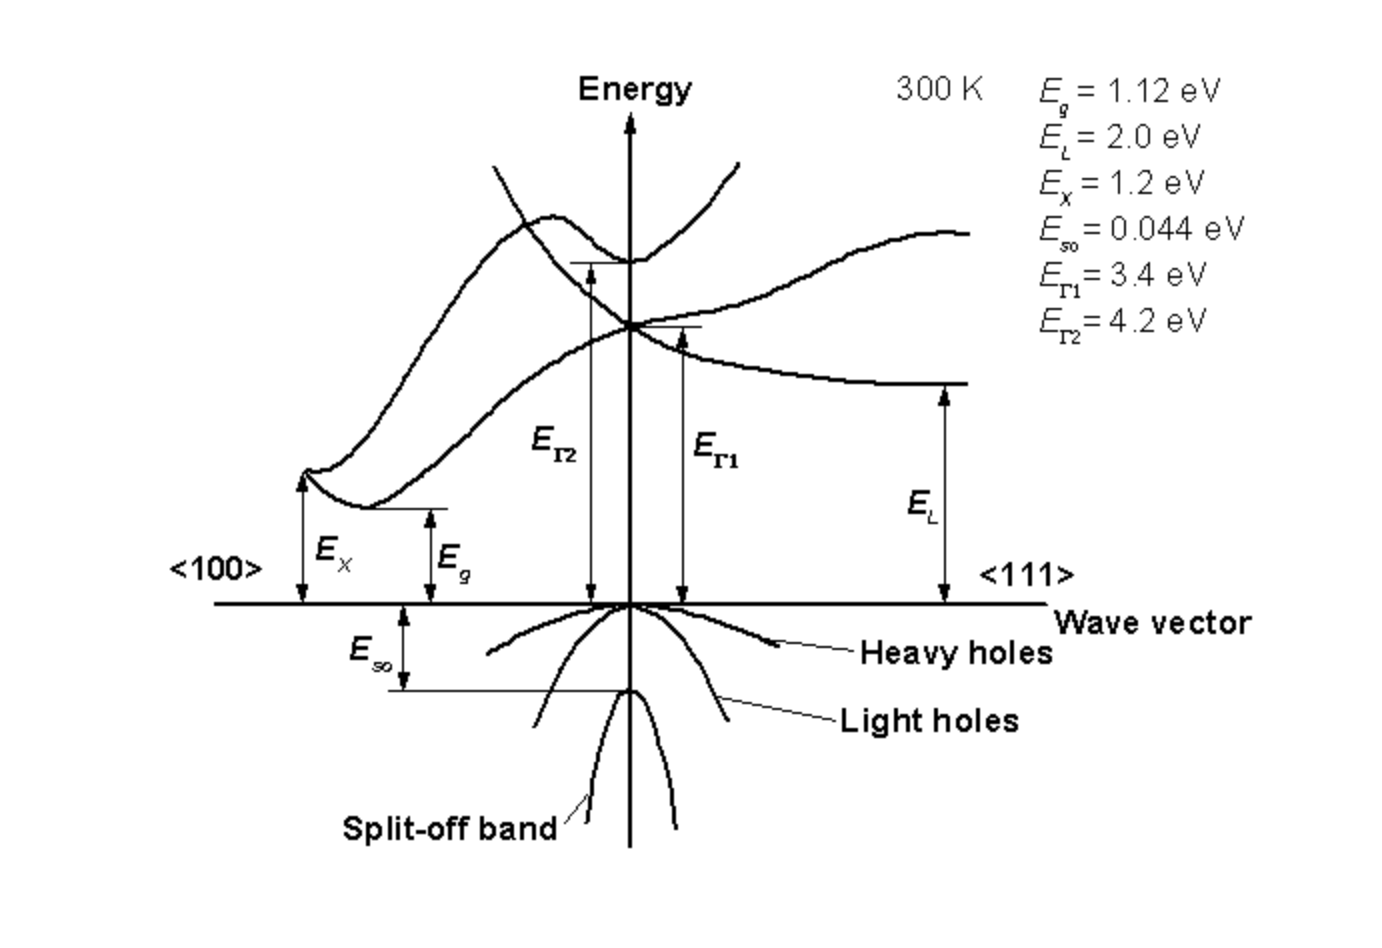
Pre-text (room temperature bandgaps): At 300 K the approximate bandgap energies are: Silicon (Si) — 1.12 eV (indirect), Gallium Arsenide (GaAs) — 1.42 eV (direct), and Germanium (Ge) — 0.66 eV (indirect). Germanium therefore has the smallest bandgap at room temperature.
Group Velocity and Momentum from the E–k Diagram
Group velocity is the velocity of a wave packet. A wave packet is a linear combination of constant energy (E) wave function solutions around energy E with unity probability of finding the particle in the packet.
The group velocity of an electron wave packet in a crystal is obtained from the slope of the E–k curve:
Where:
- → Group velocity
- → Reduced Planck's constant
- → Slope of the E–k curve
Interpretation of the slope:
- A steep slope ⇒ high group velocity
- A flat slope ⇒ low or zero group velocity (e.g., at the top of the valence band or bottom of the conduction band)
The crystal momentum ( is momentum of carrier in the crystal) is related to the wavevector by:
Conduction:
- Electrons occupy states in the conduction band above the bandgap.
- Holes correspond to unoccupied states in the valence band.
- Near the band extrema, the curvature of the E–k plot is directly linked to the effective mass of carriers.
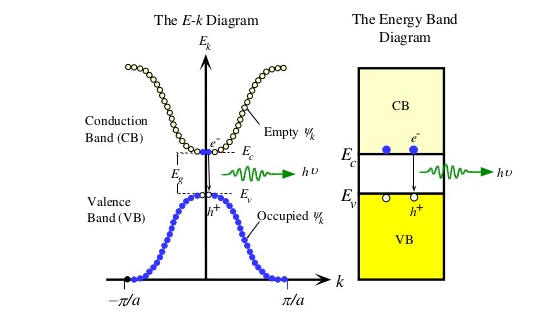
Diagram showing E-k diagram with conduction band (CB), valence band (VB), and bandgap (BG)
Effective Mass
The effective mass () is the electron mass incorporating the effect of the crystal lattice. It characterizes how an electron responds to an external force inside a crystal lattice.
It is derived from the curvature of the E–k relation:
Inverse curvature → lighter effective mass
Higher curvature → easier acceleration
Physical interpretations:
- Large curvature (sharp bending) → small → carriers accelerate easily.
- Small curvature (flatter band) → large → carriers respond sluggishly.
In three dimensions, the acceleration of a carrier under an applied force is:
Band Gap Energy
The band gap energy () is the energy difference between the conduction band minimum (CBM) and the valence band maximum (VBM):
Where:
- → Conduction band edge energy
- → Valence band edge energy
Types of band gaps:
- Direct bandgap:
- CBM and VBM occur at the same -value.
- Direct band transitions: Only (photon emission) changes during transitions.
- Allows efficient optical transitions.
- Indirect bandgap:
- CBM and VBM occur at different -values.
- Indirect band transitions: Both (photon) and (momentum) change during transitions.
- Requires phonon assistance for momentum conservation ().
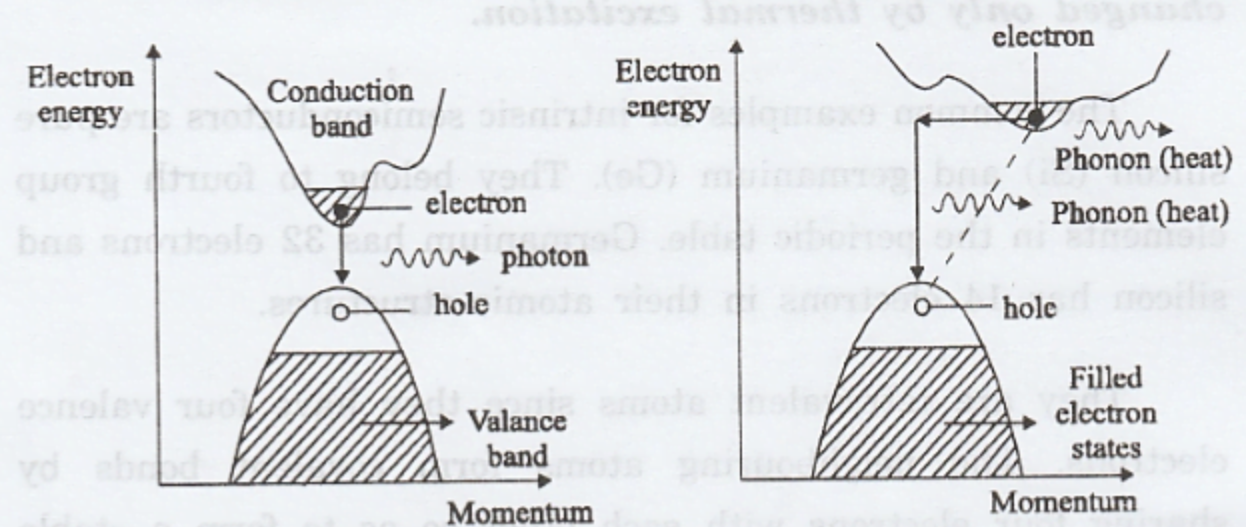
Diagrams showing direct band transitions (left) with only photon emission, and indirect band transitions (right) requiring phonon assistance for momentum conservation. (If this image is from an external source, please add appropriate reference.)