
Fatigue Cyclic Load Test of Materials
Theory of experiment:
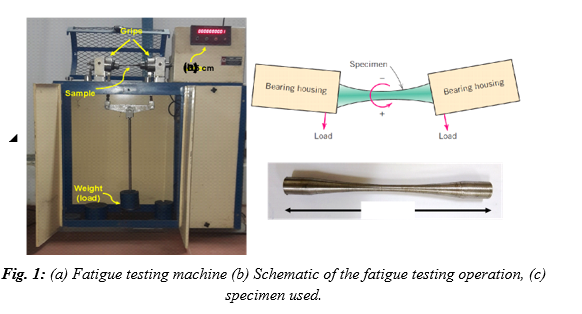
1. Brief description of the equipment/machine: The R. R. Moore type (rotating beam fatigue testing) fatigue machine is shown in Fig.1a. The machine design is based on the rotating beam principle (shown in Fig. 1b). The specimen functions as a simple beam symmetrically loaded at two points. When rotated one half revolution, the stresses in the fibers originally below the neutral axis are reversed from tension to compression and vice versa. Upon completing the revolution, the stresses are again reversed so that during one revolution the test specimen passes through a complete cycle of flexural stress (tension and compression). The specimen for this test is shown in Fig. 1c.
Fatigue: Fatigue is a degradation of mechanical properties leading to failure of a material or a component under cyclic loading, such as connecting rod of a petrol engine, wings of an aircraft etc. Failure can occur at stresses well below ultimate tensile strength (UTS) and often below the yield strength (YS) of the material. The term “fatigue” is used because this type of failure normally occurs after a lengthy period of repeated stress or strain cycling. Fatigue study is extremely important as it is the single largest cause of failure in metals, estimated to comprise approximately 90% of all metallic failures. Furthermore, fatigue is catastrophic and insidious, occurring very suddenly and without warning.
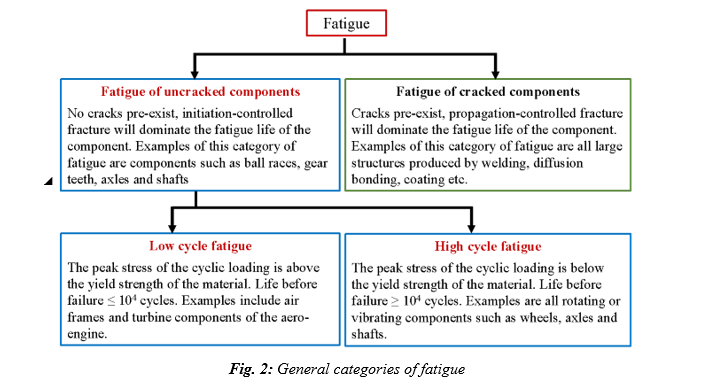
The regime in which the peak stress is above the yield strength of the material is referred to as the low cycle fatigue. Components usually endure smaller than 10 4 cycles during low cycle fatigue. In contrast, when the peak cyclic stress is below the yield strength of the material, the component sustains more than 104 cycles and the regime is referred to as the high cycle fatigue. Fig. 2 depicts some of the general characteristics of fatigue.
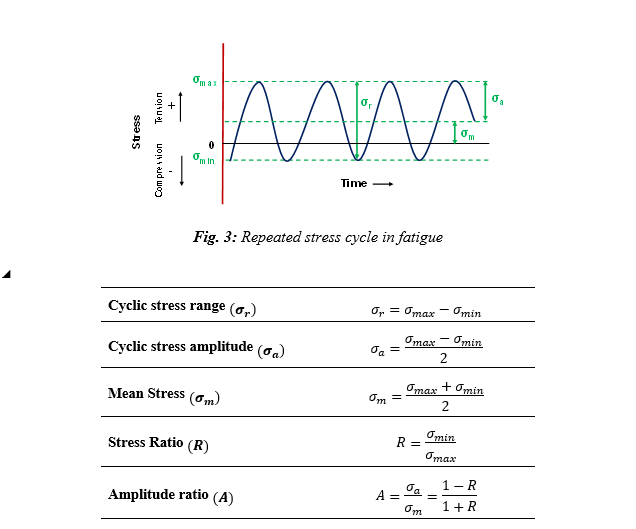
Important parameters and equations in fatigue: Many fluctuating stress-time modes are possible. One of them is shown is Fig. 3, also called repeated stress cycle, in which maximum and minimum stresses are asymmetrical relative to the zero-stress level. Parameters used to characterize the fluctuating stress cycle are shown in Fig. 4 and their definitions (formula) are given below.
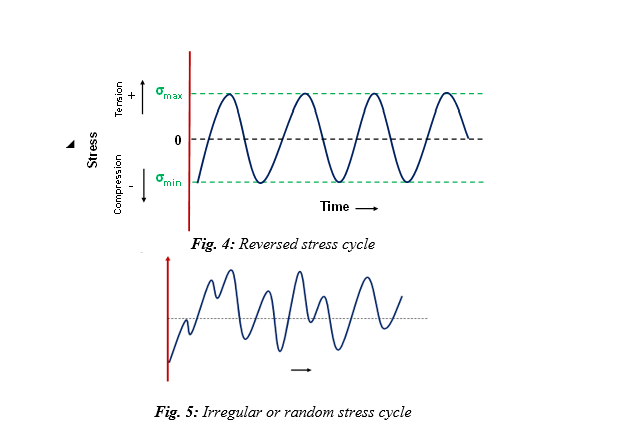
Reversed stress cycle (i.e., R. R. Moore type fatigue testing machine) is a special case of Fig. 3, where amplitude is symmetrical about a zero mean stress (σm = 0), i.e., maximum tensile stress is equal in magnitude to minimum compressive stress. For a fully reversed stress cycle (Fig. 4), the stress ratio, R is -1. Fig. 5 shows random stress cycle, where the stress level may vary randomly in amplitude and frequency. It should be noted that fatigue testing can be performed in vertical machine (particularly hydraulic driven) like tensile testing machine
The situation in R. R. Moore type fatigue testing machine is of four-point bending and reversed stress cycle and therefore peak stress is equal to the stress amplitude (σa). Peak stress (σa) in four-point bending is given by:
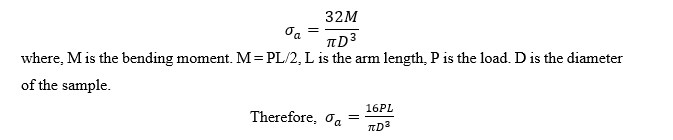
For vertical fatigue testing machine, the stress is simply load/cross-sectional area.
4. The S-N curve: The basic method of presenting fatigue data is by means of the S-N curve, a plot of stress (S) against the logarithm of the number of cycles to failure (N). The values of S are normally taken as stress amplitudes; on occasion, σmax or σmin values may be used. Several samples are subjected to stress cycling and the number of cycles to failure is counted.
Two distinct types of S-N behavior are observed, which are shown schematically in Fig. 7.
- For some ferrous (iron base) and titanium alloys, the S-N curve (Fig. 6) becomes horizontal at higher N values; or there is a limiting stress level, called the fatigue limit (also called as endurance limit), below which fatigue failure will not occur. This fatigue limit represents the largest value of fluctuating stress that will not cause failure for essentially an infinite number of cycles. For many steels, fatigue limits range between 35% and 60% of the tensile strength.
- Most nonferrous alloys (e.g., Al, Cu, Mg) do not have a fatigue limit, i.e., S-N curve continues its downward trend at increasingly greater N values (Fig. 7). Thus, fatigue will ultimately occur regardless of the magnitude of the stress. For these materials, the fatigue response is specified as fatigue strength, which is defined as the stress level at which failure will occur for some specified number of cycles, i.e., 107 cycles.
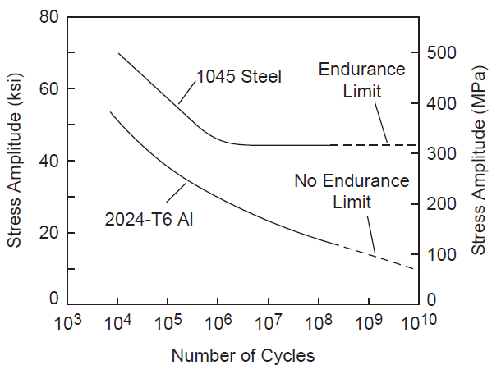
Fig. 6 S-N curve for 2024-T6 Al alloy and 1045 Steel
Fig. 6 shows the S-N curve for 2024-T6 Al alloy and 1045 Steel [1]. It can be observed that steel exhibits endurance limit; however, Al alloy does not exhibit endurance limit.
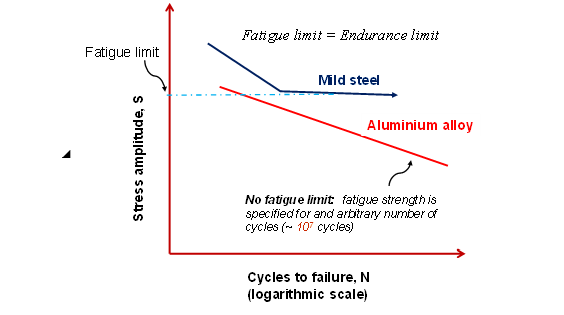
Fig. 7 Types of S-N curve
[1] Samatham Madhukar, International Journal of Current Engineering and Technology, 8 (2018)