
To simulate Electrocardiogram Waveform
Theory
Human heart is a muscle that works continuously, much like a pump. Each beat of human heart is set in motion by an electrical signal from within heart muscle. The electrical activity of heart is recorded by an electrocardiogram, known as an EKG or ECG.
Human heart's electrical system controls all the events that occur when heart pumps blood. The electrical system also is called the cardiac conduction system. If you've ever seen the heart test called an EKG (electrocardiogram), you've seen a graphical picture of the heart's electrical activity.
Human heart's electrical system is made up of three main parts:
- The sinoatrial (SA) node, located in the right atrium of heart
- The atrioventricular (AV) node, located on the interatrial septum close to the tricuspid valve
- The His-Purkinje system, located along the walls of heart's ventricles
A heartbeat is a complex series of events that take place in human heart. A heartbeat is a single cycle in which heart's chambers relax and contract to pump blood. This cycle includes the opening and closing of the inlet and outlet valves of the right and left ventricles of heart.
Each heartbeat has two basic parts: diastole and atrial and ventricular systole. During diastole, the atria and ventricles of heart relax and begin to fill with blood.
At the end of diastole, heart's atria contract (atrial systole) and pump blood into the ventricles. The atria then begin to relax and ventricles contract (ventricular systole), pumping blood out of heart.
Each beat of heart is set in motion by an electrical signal from within heart muscle. In a normal, healthy heart, each beat begins with a signal from the SA node. This is why the SA node is sometimes called heart's natural pacemaker. Human pulse, or heart rate, is the number of signals the SA node produces per minute.
The signal is generated as the two vena cavae fill heart's right atrium with blood from other parts of body. The signal spreads across the cells of heart's right and left atria. This signal causes the atria to contract. This action pushes blood through the open valves from the atria into both ventricles.
The signal arrives at the AV node near the ventricles. It slows for an instant to allow heart's right and left ventricles to fill with blood. The signal is released and moves along a pathway called the bundle of His, which is located in the walls of heart's ventricles.
From the bundle of His, the signal fibers divide into left and right bundle branches through the Purkinje fibers that connect directly to the cells in the walls of heart's left and right ventricles
The signal spreads across the cells of ventricle walls, and both ventricles contract. However, this doesn't happen at exactly the same moment. The left ventricle contracts an instant before the right ventricle. This pushes blood through the pulmonary valve (for the right ventricle) to lungs and through the aortic valve (for the left ventricle) to the rest of your body.
As the signal passes, the walls of the ventricles relax and await the next signal.
This process continues over and over as the atria refill with blood and other electrical signals come from the SA node.
As the heart undergoes depolarization and repolarization, the electrical currents that are generated spread not only within the heart, but also throughout the body. This electrical activity generated by the heart can be measured by an array of electrodes placed on the body surface. The recorded tracing is called an electrocardiogram (ECG, or EKG). A "typical" ECG tracing is shown in figure 1. The different waves that comprise the ECG represent the sequence of depolarization and repolarization of the atria and ventricles. The ECG is recorded at a speed of 25 mm/sec, and the voltages are calibrated so that 1 mV = 10 mm in the vertical direction. Therefore, each small 1-mm square represents 0.04 sec (40 msec) in time and 0.1 mV in voltage. Because the recording speed is standardized, one can calculate the heart rate from the intervals between different waves.
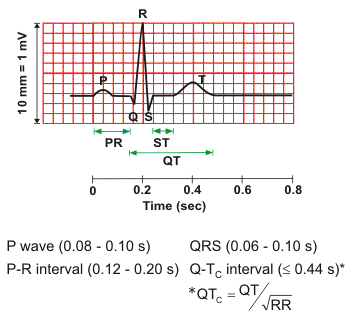
P wave
The P wave represents the wave of depolarization that spreads from the SA node throughout the atria, and is usually 0.08 to 0.1 seconds (80-100 ms) in duration. The brief isoelectric (zero voltage) period after the P wave represents the time in which the impulse is traveling within the AV node (where the conduction velocity is greatly retarded) and the bundle of His. Atrial rate can be calculated by determining the time interval between P waves.
The period of time from the onset of the P wave to the beginning of the QRS complex is termed the P-R interval, which normally ranges from 0.12 to 0.20 seconds in duration. This interval represents the time between the onset of atrial depolarization and the onset of ventricular depolarization. If the P-R interval is >0.2 sec, there is an AV conduction block , which is also termed a first-degree heart block if the impulse is still able to be conducted into the ventricles.
QRS complex
The QRS complex represents ventricular depolarization. Ventricular rate can be calculated by determining the time interval between QRS complexes. The duration of the QRS complex is normally 0.06 to 0.1 seconds. This relatively short duration indicates that ventricular depolarization normally occurs very rapidly. If the QRS complex is prolonged (> 0.1 sec), conduction is impaired within the ventricles. This can occur with bundle branch blocks or whenever a ventricular foci (abnormal pacemaker site) becomes the pacemaker driving the ventricle. Such an ectopic foci nearly always results in impulses being conducted over slower pathways within the heart, thereby increasing the time for depolarization and the duration of the QRS complex.
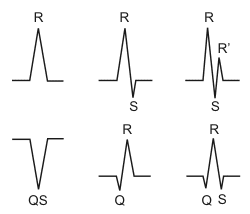
The shape of the QRS complex in the above figure 2 is idealized. In fact, the shape changes depending on which recording electrodes are being used. The shape will also change when there is abnormal conduction of electrical impulses within the ventricles. The figure 2 summarizes the nomenclature used to define the different components of the QRS complex.
ST segment
The isoelectric period (ST segment) following the QRS is the time at which the entire ventricle is depolarized and roughly corresponds to the plateau phase of the ventricular action potential. The ST segment is important in the diagnosis of ventricular ischemia or hypoxia because under those conditions, the ST segment can become either depressed or elevated .
T wave
The T wave represents ventricular repolarization and is longer in duration than depolarization (i.e., conduction of the repolarization wave is slower than the wave of depolarization). Sometimes a small positive U wave may be seen following the T wave (not shown in figure 1). This wave represents the last remnants of ventricular repolarization. Inverted or prominent U waves indicate underlying pathology or conditions affecting repolarization.
Q-T interval
The Q-T interval represents the time for both ventricular depolarization and repolarization to occur, and therefore roughly estimates the duration of an average ventricular action potential. This interval can range from 0.2 to 0.4 seconds depending upon heart rate. At high heart rates, ventricular action potentials shorten in duration, which decreases the Q-T interval. Because prolonged Q-T intervals can be diagnostic for susceptibility to certain types of tachyarrhythmias, it is important to determine if a given Q-T interval is excessively long. In practice, the Q-T interval is expressed as a "corrected Q-T (QTc)" by taking the Q-T interval and dividing it by the square root of the R-R interval (interval between ventricular depolarizations). This allows an assessment of the Q-T interval that is independent of heart rate. Normal corrected Q-Tc intervals are less than 0.44 seconds.
There is no distinctly visible wave representing atrial repolarization in the ECG because it occurs during ventricular depolarization. Because the wave of atrial repolarization is relatively small in amplitude (i.e., has low voltage), it is masked by the much larger ventricular-generated QRS complex.
ECG tracings recorded simultaneous from different electrodes placed on the body produce different characteristic waveforms.
Electrocardiogram Standard Limb Leads (Bipolar)
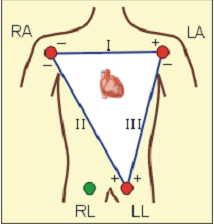
Bipolar recordings utilize standard limb lead configurations depicted as shown in fig. 3. By convention, lead I have the positive electrode on the left arm, and the negative electrode on the right arm, and therefore measure the potential difference between the two arms. In this and the other two limb leads, an electrode on the right leg serves as a reference electrode for recording purposes. In the lead II configuration, the positive electrode is on the left leg and the negative electrode is on the right arm. Lead III has the positive electrode on the left leg and the negative electrode on the left arm. These three bipolar limb leads roughly form an equilateral triangle (with the heart at the center) that is called Einthoven's triangle in honor of Willem Einthoven who developed the electrocardiogram in 1901. Whether the limb leads are attached to the end of the limb (wrists and ankles) or at the origin of the limb (shoulder or upper thigh) makes no difference in the recording because the limb can simply be viewed as a long wire conductor originating from a point on the trunk of the body.
Based upon universally accepted ECG rules, a wave a depolarization heading toward the left arm gives a positive deflection in lead I because the positive electrode is on the left arm. Maximal positive ECG deflection occurs in lead I when a wave of depolarization travels parallel to the axis between the right and left arms. If a wave of depolarization heads away from the left arm, the deflection is negative. Also by these rules, a wave of re-polarization moving away from the left arm is recorded as a positive deflection. Similar statements can be made for leads II and III in which the positive electrode is located on the left leg. For example, a wave of depolarization travelling toward the left leg produces a positive deflection in both leads II and III because the positive electrode for both leads is on the left leg. A maximal positive deflection is recorded in lead II when the depolarization wave travels parallel to the axis between the right arm and left leg. Similarly, a maximal positive deflection is obtained in lead III when the depolarization wave travels parallel to the axis between the left arm and left leg.
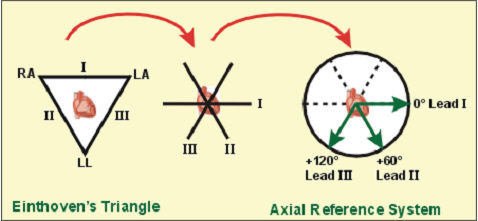
If the three limbs of Einthoven's triangle (assumed to be equilateral) are broken apart, collapsed, and superimposed over the heart, then the positive electrode for lead I is said to be at zero degrees relative to the heart (along the horizontal axis) as shown in fig. 4. Similarly, the positive electrode for lead II will be +60° relative to the heart, and the positive electrode for lead III will be +120° relative to the heart as shown to the right. This new construction of the electrical axis is called the axial reference system. With this system, a wave of depolarization travelling at +60° produces the greatest positive deflection in lead II. A wave of depolarization oriented +90° relative to the heart produces equally positive deflections in both lead II and III. In this latter example, lead I show no net deflection because the wave of depolarization is heading perpendicular to the 0°, or lead I, axis.
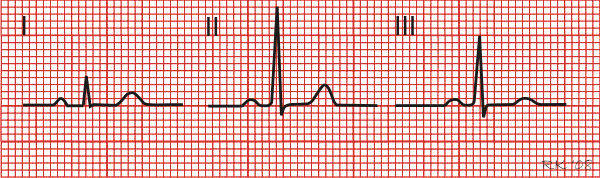
For a heart with a normal ECG and a mean electrical axis of +60°, the standard limb leads will appear as follows:
Determining Heart Rate from the Electrocardiogram
The term "heart rate" normally refers to the rate of ventricular contractions. However, because there are circumstances in which the atrial and ventricular rates differ (e.g., second and third degree AV block), it is important to be able to determine both atrial and ventricular rates. This is easily done by examining an ECG rhythm strip, which is usually taken from Lead II. In the example below, there are four numbered R waves, each of which is preceded by a P wave. Therefore, the atrial and ventricular rates will be the same because there is a one-to-one correspondence. Atrial rate can be determined by measuring the time intervals between P waves (P-P intervals). Ventricular rate can be determined by measuring the intervals between the QRS complexes, which is done by looking at the R-R intervals.
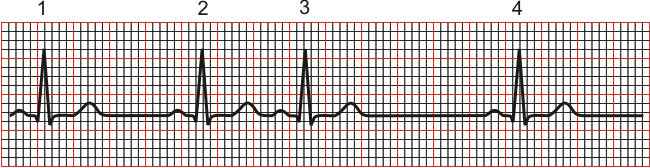
There are different methods that can be used to calculate heart rate, all of which assume a recording speed of 25 mm/sec. One method is to divide 1500 by the number of small squares between two R waves. For example, the rate between beats 1 and 2 in the above tracing is 1500/22, which equals 68 beats/min. Alternatively, one can divide 300 by the number of large squares (red boxes in this diagram), which is 300/4.4 (68 beats/min). Another method, which gives a rough approximation, is the "count off" method. Simply count the number of large squares between R waves with the following rates: 300 - 150 - 100 - 75 - 60. For example, if there are three large boxes between R waves, then the rate is 100 beats/min. One must extrapolate, however, between boxes. Atrial rate can be determined like the ventricular rate, but using the P waves. Remember, if the heart in sinus rhythm and there is a one-to-one correspondence between P waves and QRS completes, then the atrial rate will be the same as ventricular rate.
In the above examples, the ventricular rate was determined based on the interval between the first two beats. However, it is obvious that the rate would have been faster had it been calculated using beats 2 and 3 (104 beats/min) because of a premature atrial beat, and slower if it had been calculated between beats 3 and 4 (52 beats/min). This illustrates an important point when calculating rate between any given pair of beats. If the rhythm is not steady, it is important to determine a time-averaged rate over a longer interval (e.g., over ten seconds or longer). For example, because the recording time scale is 25 mm/sec, if there are 12.5 beats in 10 seconds, the rate will be 75 beats/min.
Various Sources of Noise:
Sources of & the remedial action to combat the following sources of artefact: Environmental AC fields; EMG interference; Electrode-skin interface problems
1. Noise originating from sources outside the patient
- Electrostatic sources
- Patient acts as one plate of a capacitor
- Seen when a charged body is brought up close to an uncharged one, an equal & opposite charge develops on the uncharged body
- Eg, if an unearthed body is close to any cable or lamp element that is connected to mains, he will develop a surface charge of equal & opposite potential even though no current is flowing between the two bodies
- As the mains potential has a frequency of 50 Hz, the induced potential will also have this frequency
- Other sources of electrostatic charge include the operating table, other persons, electronic equipment
- Electromagnetic induction
- An interference that occurs in the vicinity of wires carrying AC currents
- Results in 50 Hz interference
- Due to the generation of a magnetic field by the flow of a current: all conductors carrying mains currents are surrounded by electromagnetic fields
- The 50 Hz interference is a difference in potential, relative to the ground, that is impressed upon any subject in proximity to the wire carrying alternating current the subject takes on a potential that is neither that of ground, nor of the power line, but somewhere in between.Since the utility current is fluctuating, the voltage of the subject is also fluctuating
- Effect is minimised by the fact that the electromagnetic field generated by the live wire is to a greater degree cancelled out by the neutral cable flowing adjacent to the live cable but flowing in the opposite direction
- Radiofrequency Interference [> 100 kHz]
May enter via
- Mains distribution system mixed up with 50 Hz current; sources include diathermy, electric motors
- Radio propagation whereby activated diathermy probe held in air acts as radio transmitter aerial while the patient ECG lead acts as a receiving aerial
- Remedial action
- Differential analyser
- High CMRR
- Shielded patient circuitry with copper or aluminum enclosure
- "Floating" RL ECG
- Surrounding each lead with a braided copper screen to minimize electrostatic induction
- Keep leads as short as possible
- Mitigate effects of electromagnetic fields by ensuring all of patient's leads are of the same length, are closely bound together or even twisted together until close to the electrodes thereby ensuring that the induced signals are identical & therefore susceptible to CMRR
- Eliminate source of unwanted electromagnetic radiation (only real cure)
2. Noise originating from the patient
- EMG [electromyogram]
- Frequency (Hz) overlap those of EEG & ECG
- Signal can be much larger (increased mV) than either EEG or EGG
- Muscular activity (especially shivering) can lead to gross interference
- Muscle artefact
- Remedial action
- Minimise patent movement ie relax
- Minimise shivering
- Avoid muscle area to place electrodes; use bony prominences
3. Noise originating from patient-electrode contact
Unfortunately, recording electrodes do not act as a passive conductor
- The placement of a metal next to an electrolyte solution as seen on the surface of skin produces an electrochemical half-cell resulting in the generation of an electromagnetic force
- If a differential amplifier is connected to a pair of such electrodes, their output potentials are compared
- If the cells are identical, the outputs will be self cancelling yielding zero output
- If the cells are not identical, the difference in potential between the two cells will be amplified\
- Additionally, the small current produced by the offset potential may result in polarisation\ - A polarised electrode will distort any signal\ - Mechanical movement of recording electrodes results in changes in potential - Due to alteration in the physical dimensions of the electrode-skin half cell thus modifying cell potential and skin-electrode impedance
- Remedial action
- Abrade skin, remove hair, alcohol to ensure adhesion of electrode
- Use of Ag:AgCl electrode which does not polarise
Heart Disease Human heart is made up of many parts working together to pump blood. In a healthy heart, all the parts work well so that your heart pumps blood normally. As a result, all parts of body that depend on the heart to deliver blood also stay healthy. Heart disease can disrupt a heart's normal electrical system and pumping functions. Diseases and conditions of the heart's muscle make it hard for heart to pump blood normally. Damaged or diseased blood vessels make the heart work harder than normal. Problems with the heart's electrical system, called arrhythmias (ah-RITH-me-ahs), can make it hard for the heart to pump blood efficiently.
Abnormal Rhythms - Definitions
General Terms:
Normal sinus rhythm - heart rhythm controlled by sinus node at a rate of 60-100 beats/min; each P wave followed by QRS and each QRS preceded by a P wave.
Bradycardia - a heart rate that is lower than normal.
Tachycardia - a heart rate that is higher than normal.
Paroxysmal - an arrhythmia that suddenly begins and ends.
Specific Arrhythmias:
Sinus bradycardia - low sinus rate <60 beats/min.
Sinus tachycardia - high sinus rate of 100-180 beats/min as occurs during exercise or other conditions that lead to increased SA nodal firing rate.
Sick sinus syndrome - a disturbance of SA nodal function that results in a markedly variable rhythm (cycles of bradycardia and tachycardia).
Atrial tachycardia - a series of 3 or more consecutive atrial premature beats occurring at a frequency >100/min; usually due to abnormal focus within the atria and paroxysmal in nature, therefore appearance of P wave is altered in different ECG leads. This type of rhythm includes paroxysmal atrial tachycardia (PAT).
Atrial flutter - sinus rate of 250-350 beats/min.
Atrial fibrillation - uncoordinated atrial depolarizations.
Junction al escape rhythm - SA node suppression can result in AV node-generated rhythm of 40-60 beats/min (not preceded by P wave).
AV nodal blocks - a conduction block within the AV node (or occasionally in the bundle of His) that impairs impulse conduction from the atria to the ventricles.
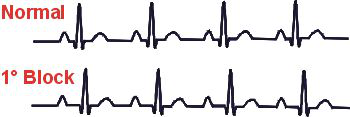
First-degree AV nodal block - the conduction velocity is slowed so that the P-R interval is increased to greater than 0.2 seconds. Can be caused by enhanced vagal tone, digitalis, beta-blockers, calcium channel blockers, or ischemic damage.
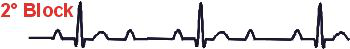
Second-degree AV nodal block - the conduction velocity is slowed to the point where some impulses from the atria cannot pass through the AV node. This can result in P waves that are not followed by QRS complexes. For example, 1 (as shown below) or 2 P waves may occur alone before one is followed by a QRS. When the QRS follows the P wave, the P-R interval is increased. In this type of block, the ventricular rhythm will be less than the sinus rhythm.
There are two subtypes of second-degree AV blocks: Mobitz I and Mobitz II. In Mobitz I (Wenkebach block), the P-R interval gradually increases over several beats until it is sufficiently prolonged (that is, AV conduction is sufficiently impaired) that the impulse fails to pass into the ventricles (i.e., a P wave will not be followed by a QRS). Mobitz II occurs is when the P-R interval is fixed in duration, but some P waves are not followed by a QRS (as illustrated below).
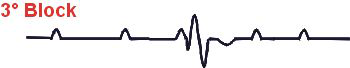
Third-degree AV nodal block - conduction through the AV node is completely blocked so that no impulses are able to be transmitted from the atria to the ventricles. QRS complexes will still occur (escape rhythm), but they will originate from within the AV node, bundle of His, or other ventricular regions. Therefore, QRS complexes will not be preceded by P waves. Furthermore, there will be complete asynchrony between the P wave and QRS complexes. Atrial rhythm may be completely normal, but ventricular rhythm will be greatly reduced depending upon the location of the site generating the ventricular impulse. Ventricular rate typically range from 30 to 40 beats/min.
Supra ventricular tachycardia (SVT) - usually caused by re-entry currents within the atria or between ventricles and atria producing high heart rates of 140-250; the QRS complex is usually normal width, unless there are also intra ventricular conduction blocks (e.g., bundle branch block).
Ventricular premature beats (VPBs) - caused by ectopic ventricular foci; characterized by widened QRS; often referred to as a premature ventricular complex, or PVC.
Ventricular tachycardia (VT) - high ventricular rate caused by aberrant ventricular aromaticity (ventricular foci) or by intra ventricular re-entry; can be sustained or non-sustained (paroxysmal); usually characterized by widened QRS (>0.14 sec); rates of 100 to 280 beats/min; life-threatening.
Ventricular flutter - very rapid ventricular depolarizations >250/min; sine wave appearance; leads to fibrillation.
Ventricular fibrillation - uncoordinated ventricular depolarizations; leads to death if not quickly converted to a normal rhythm or at least a rhythm compatible with life.