Identification of HF Modes of Beam in “Free-Free” Condition Using EMI Tech.
Objective:
Identification of high frequency axial modes of beam in "Free-Free" condition using electro-mechanical impedance(EMI) technique.
Apparatus Used:
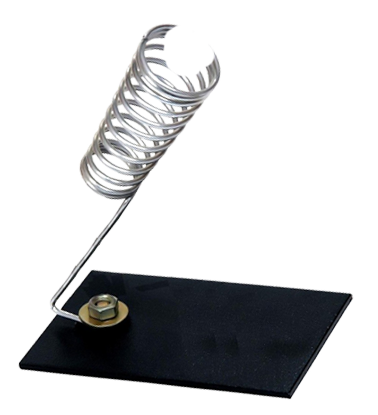
1. A stand
2. An aluminium bar
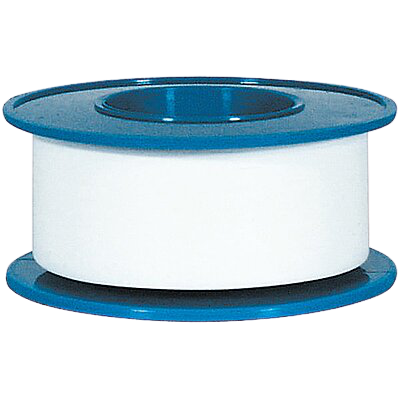
3. Cello tape
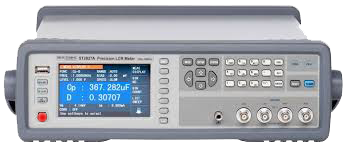
4. LCR meter
5. PZT patch


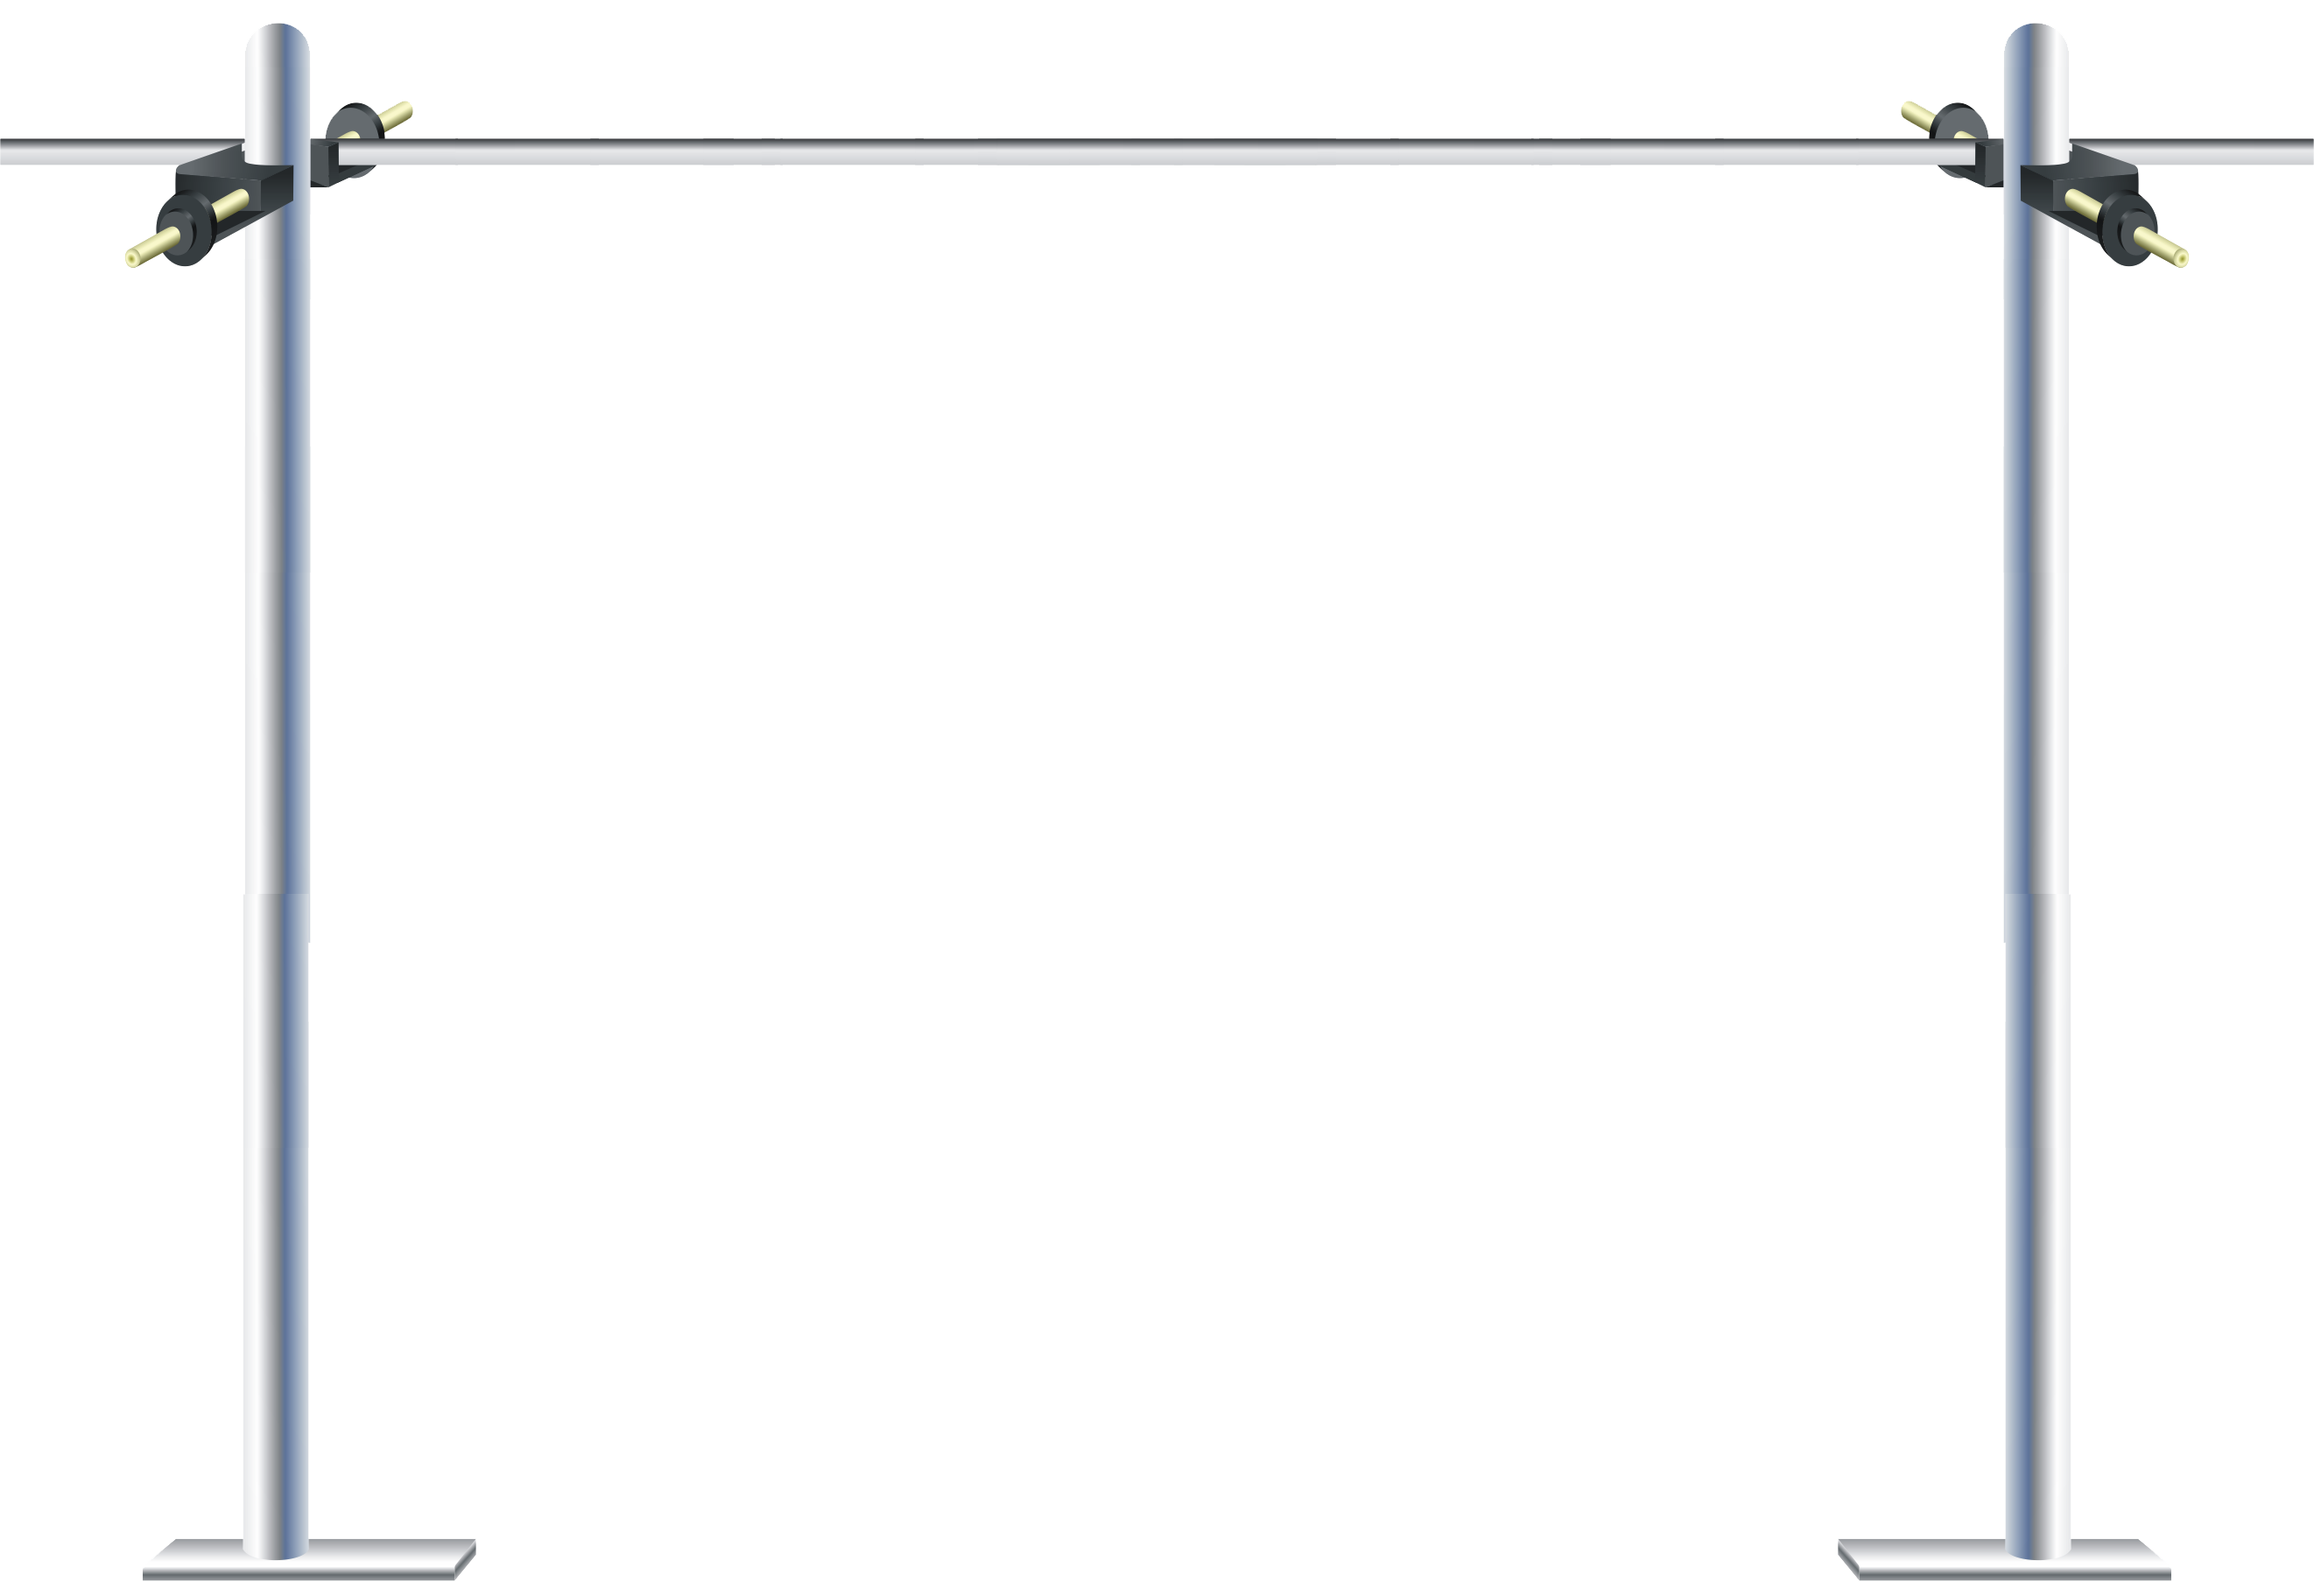
 Stand
Aluminium Bar
Cello Tape
LCR Meter
PZT Patch
Step-1: (a) Click on add button to bring a stand.
Step-1: (b) Click on add button to bring aluminium bar.
Step-1: (c) Click on add button to bring paper cutter and tape.
Step-1: (d) Click on tape to stick it on aluminium bar.
Step-1: (e) Click on paper cutter to cut the tape.
Step-1: (f) Click on tape to place it back to its original position.
Step-1: (g) Click on add button to bring a PZT patch.
Step-1: (h) Click on add button to bring epoxy.
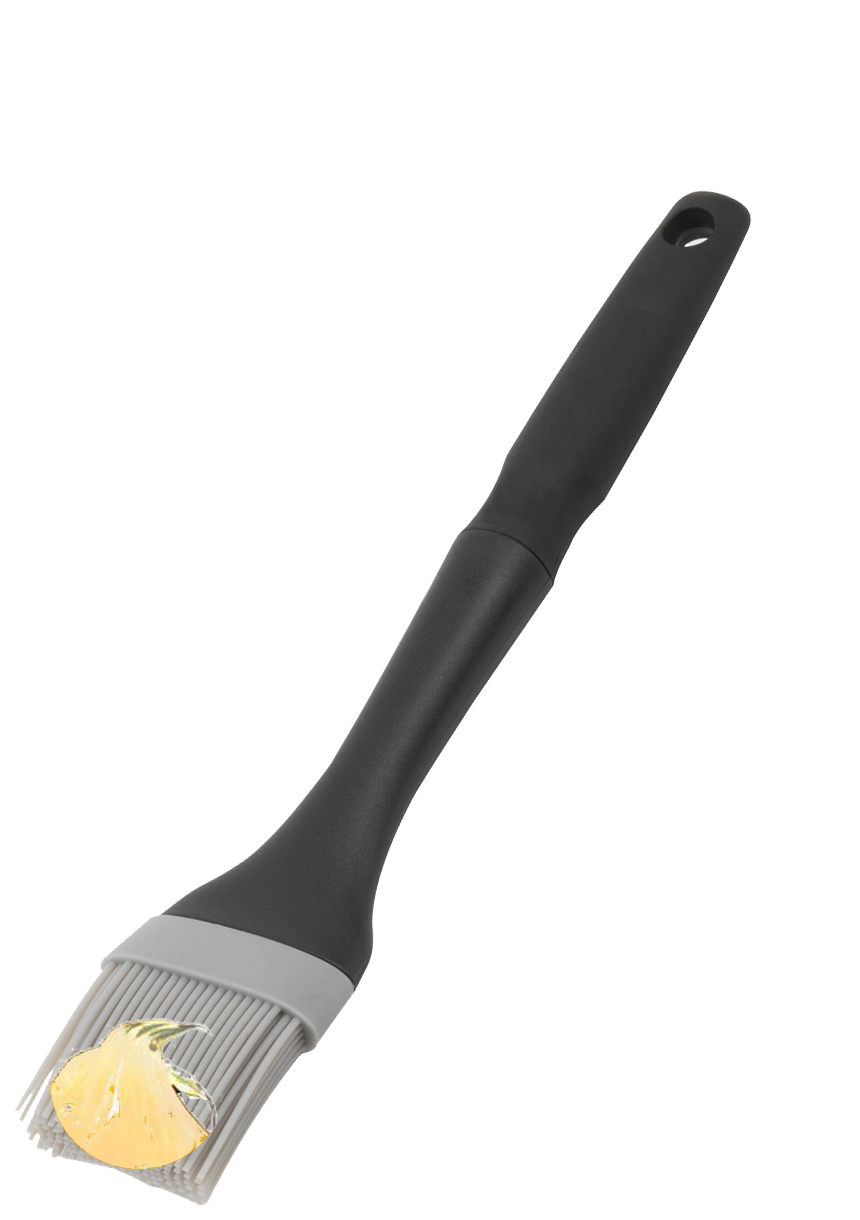
Step-1: (i) Click on brush to apply epoxy on aluminium bar.
Step-1: (j) Click on PZT patch to place it on aluminium bar .
Step-1: (k) Click on next button.







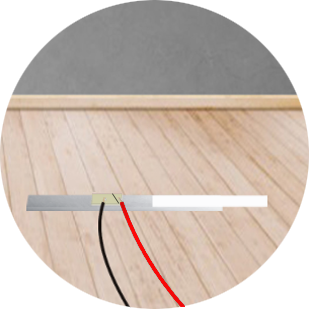
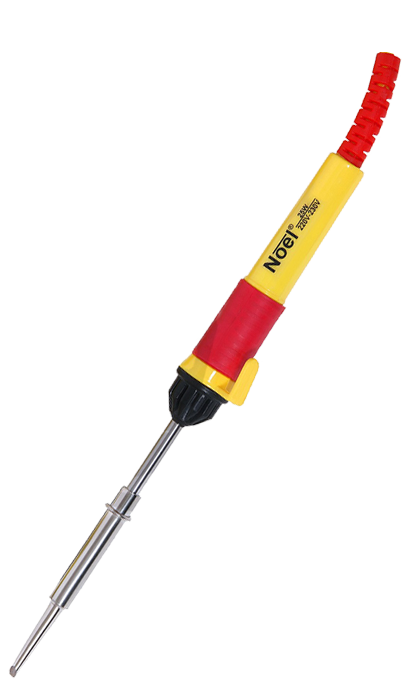
Step-2: (a) Click on add button to bring soldering rod.
Step-2: (b) Click on add button to bring wires.
Step-2: (c) Click on wire to attach it with PZT patch.
Step-2: (d) Click on another wire to attach it with PZT patch.
Step-2: (e) Click on PZT patch to see the zoom view of it.
Step-2: (f) Click on soldering rod for soldering wires.
Step-2: (g) Click on next button.






Step-3: (a) Click on add button to bring a PZT patch.
Step-3: (b) Click on brush to apply epoxy on aluminium bar.
Step-3: (c) Click on PZT patch to place it on aluminium bar.
Step-3: (d) Click on add button to bring wires.
Step-3: (e) Click on wire to attach it with PZT patch.
Step-3: (f) Click on another wire to attach it with PZT patch.
Step-3: (g) Click on PZT patch to see the zoom view of it.
Step-3: (h) Click on soldering rod for soldering wires.
Step-3: (i) Click on next button.


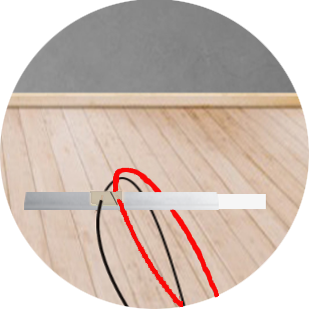


Step-4: (a) Click on aluminium bar to hanging it on the stand.
Step-4: (b) Click on add button to bring LCR.
Step-4: (c) Click on black pins one by one to attach them with PZT patch wires.
Step-4: (d) Now switch on the power button of LCR meter.
Step-4: (e) Click on next button.


Step-5: (a) Click on ok button.
Step-5: (a) Click on ok button.
Step-5: (b) Click on next button.
First select the all values!


Step-6: Calculate the natural frequency as per the theoritical formula given below:
 Refer manual of experiment in reference tab
Compare the calculated theoretical frequency with the frequency obtained through this experiment
 Refer manual of experiment in reference tab
Compare the calculated theoretical frequency with the frequency obtained through this experiment
