WELCOME TO THE X-RAY FLUORESCENCE MICROSCOPE SIMULATION
Choose the language for instructions:
XRF Control Panel
Simulation is fine, but what to do after the process has stopped? How is the chemical composition determined from this outcome?
Instrumentation parameters
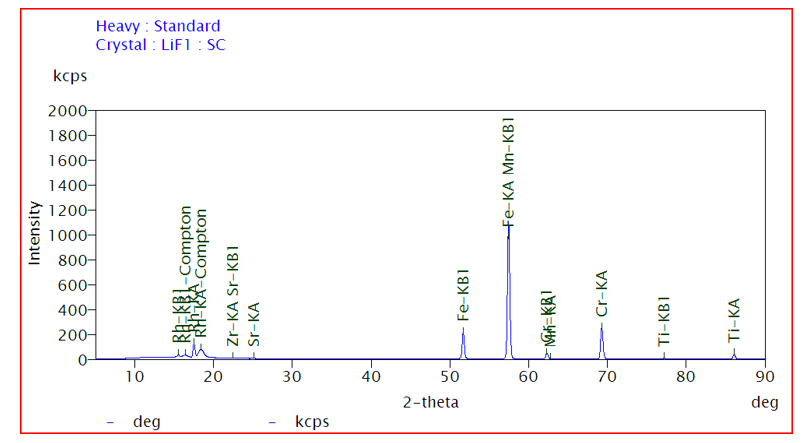
- X-axis: 2-theta (degree): The diffraction angle of the analyzing crystal
- Y-axis: Intensity (kcps): kilo-counts per second
- Crystal used: LiF1 (Lithium Fluoride): standard crystal for medium-to-heavy elements
In XRF, each element's fluorescent X-rays are diffracted at a specific 2-theta angle by the analyzing crystal (Bragg's Law), separating them physically before detection.
Step 1: Apply Bragg's Law to Understand Peak Positions
nλ = 2θ
| Parameter | Value for LiF1 |
|---|---|
| Crystal | LiF1 |
| D-spacing (2d for 200) | 4.028 Å |
| Detectable range (2-theta) | ~15° to 90° |
Each peak position (2-theta) corresponds to a unique wavelength corresponding to unique element
Step 2: From the spectrum, label all unique peaks
In given example the following peaks are clearly labeled:
| 2-Theta | Peak Label | Element |
|---|---|---|
| ~15–16° | Rh-KA-Compton, Rh-KB-Compton | Rhodium |
| ~22° | Zr-KA, Sr-KB1 | Zirconium, Strontium |
| ~25° | Sr-KA | Strontium |
| ~51° | Fe-KB1 | Iron |
| ~57° | Fe-KA | Iron |
| ~58° | Mn-KB1 | Manganese |
| ~62–63° | Mn-KA, Cr-KB1 | Manganese, Chromium |
| ~69° | Cr-KA | Chromium |
| ~76° | Ti-KB1 | Titanium |
| ~85° | Ti-KA | Titanium |
Step 3: Remove the instrument artifact peaks (NOT from sample)
| Peak | Reason to Exclude |
|---|---|
| Rh-KB1 | From the Rhodium X-ray tube anode |
| Rh-KA-Compton / Rh-KB-Compton | Compton scattering of Rh tube radiation off sample |
Step 4: The quantification of elements
The relative peak intensity of elements determined in step 3 provide the amount of respective elements present in the sample.
In given example the following intensity of peaks observed
| Element | Peak Intensity (kcps) |
Relative Abundance |
|---|---|---|
| Fe | ~1050 kcps | Major element |
| Mn | ~200 kcps | Minor element |
| Cr | ~300 kcps | Minor element |
| Ti | ~100 kcps | Trace/minor |
| Zr, Sr | <100 kcps | Trace elements |
There are four samples: metal, alloy, ceramic, polymer and composite – the plot is the same for all four? Also, it would be nice for the users to know the composition of the sample rather than pattern only.
The elemental composition of the sample (metal, alloy, ceramic and composite) can be determined as discussed above from step 1 to 4.
- For pure Metals, XRF provides the single-element dominant spectrum
- Alloys show multi-element spectra in characteristic ratios.
- Ceramics are identified by their metal oxide signatures
e.g.
Alumina (Al2O3) → strong Al signal
Zirconia (ZrO2) → strong Zr signal
However, XRF cannot directly detect oxygen, so structural/bonding information is inferred, not directly measured. - For polymers, XRF provides weakest signal as polymers are composed mainly of C, H, O, N, light elements that XRF struggles to detect reliably