Vibration Characteristics of Aluminium Cantilever Beam Using PZT Sensor
Objective:
To study the vibration characteristics of an aluminium cantilever beam using piezoelectric-ceramic (PZT) sensor.
Apparatus Used:
1. Digital multimeter
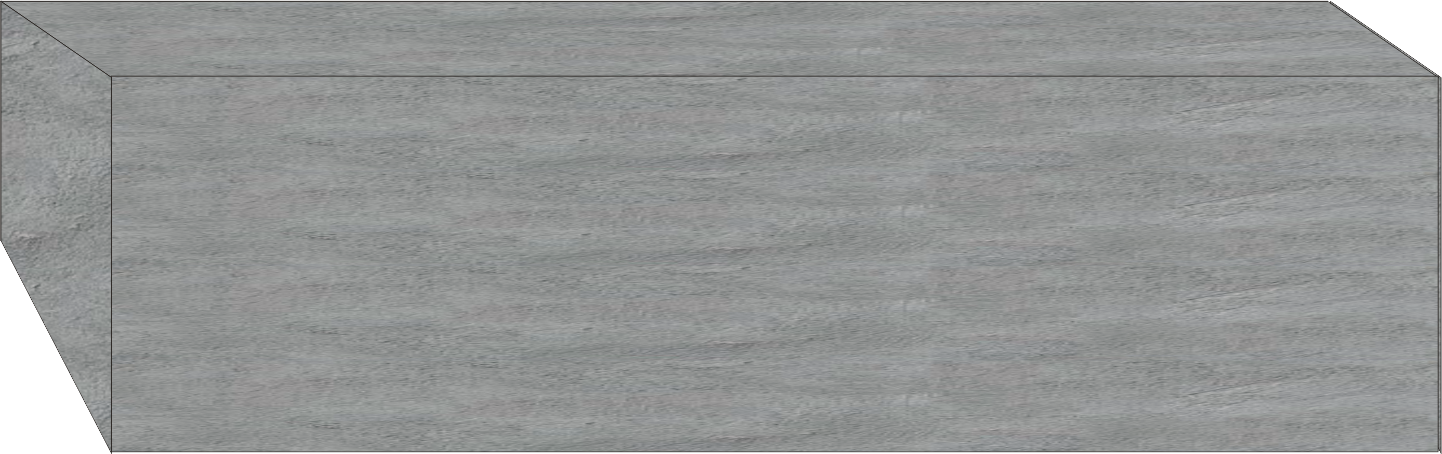
2. Concrete blocks
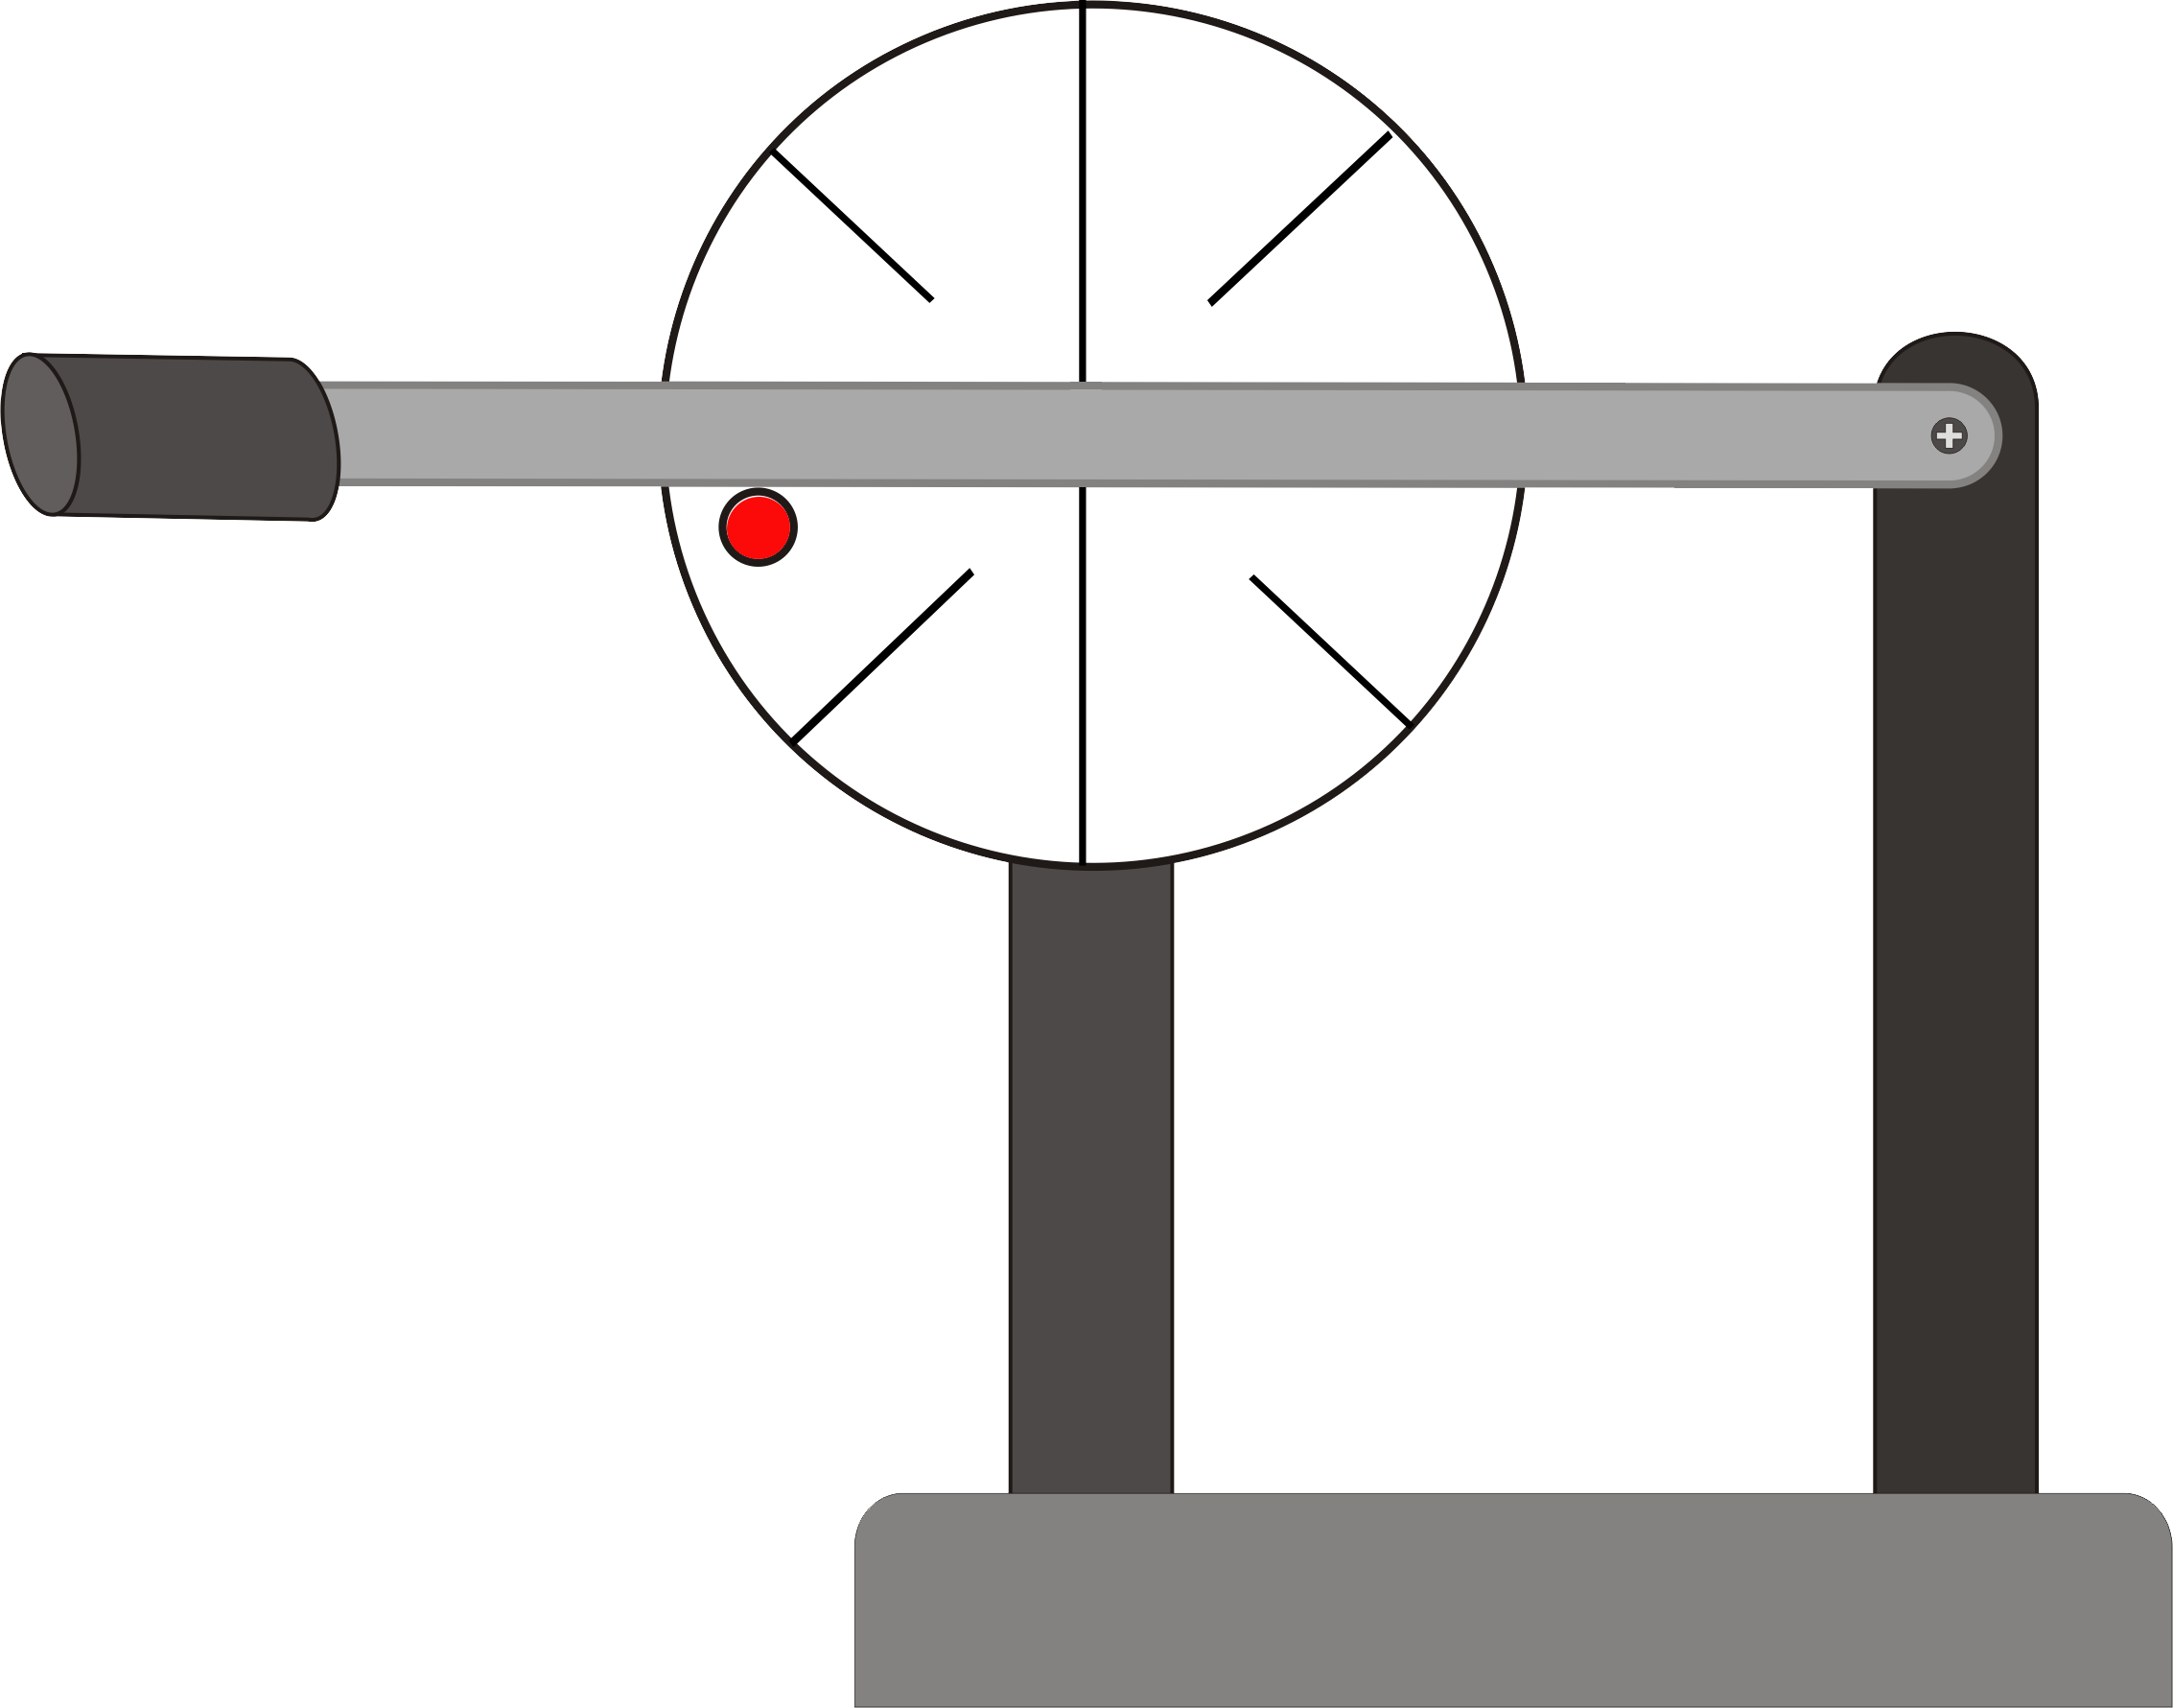
3. Hammer
4. PZT patch
5. Aluminium cantilever


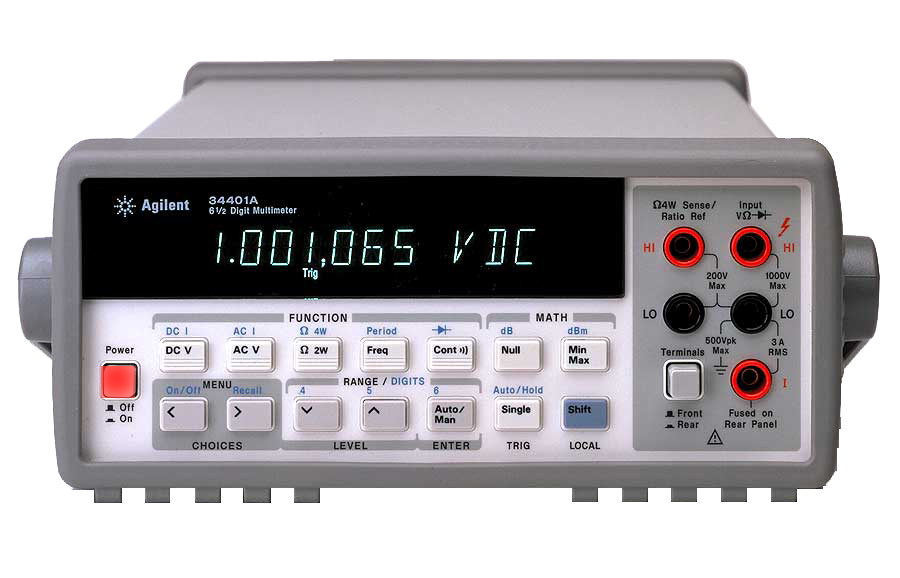 Digital Multimeter
Concrete Blocks
Hammer
PZT Patch
Aluminium Cantilever
Digital Multimeter
Concrete Blocks
Hammer
PZT Patch
Aluminium Cantilever
Step-1: (a) Click on add button to bring aluminium cantilever.
Step-1: (b) Click on add button to bring concrete block.
Step-1: (c) Click on aluminium cantilever to place it on the concrete block.
Step-1: (d) Click on add button to bring another concrete block.
Step-1: (e) Click on concrete block to place it on the aluminium cantilever.
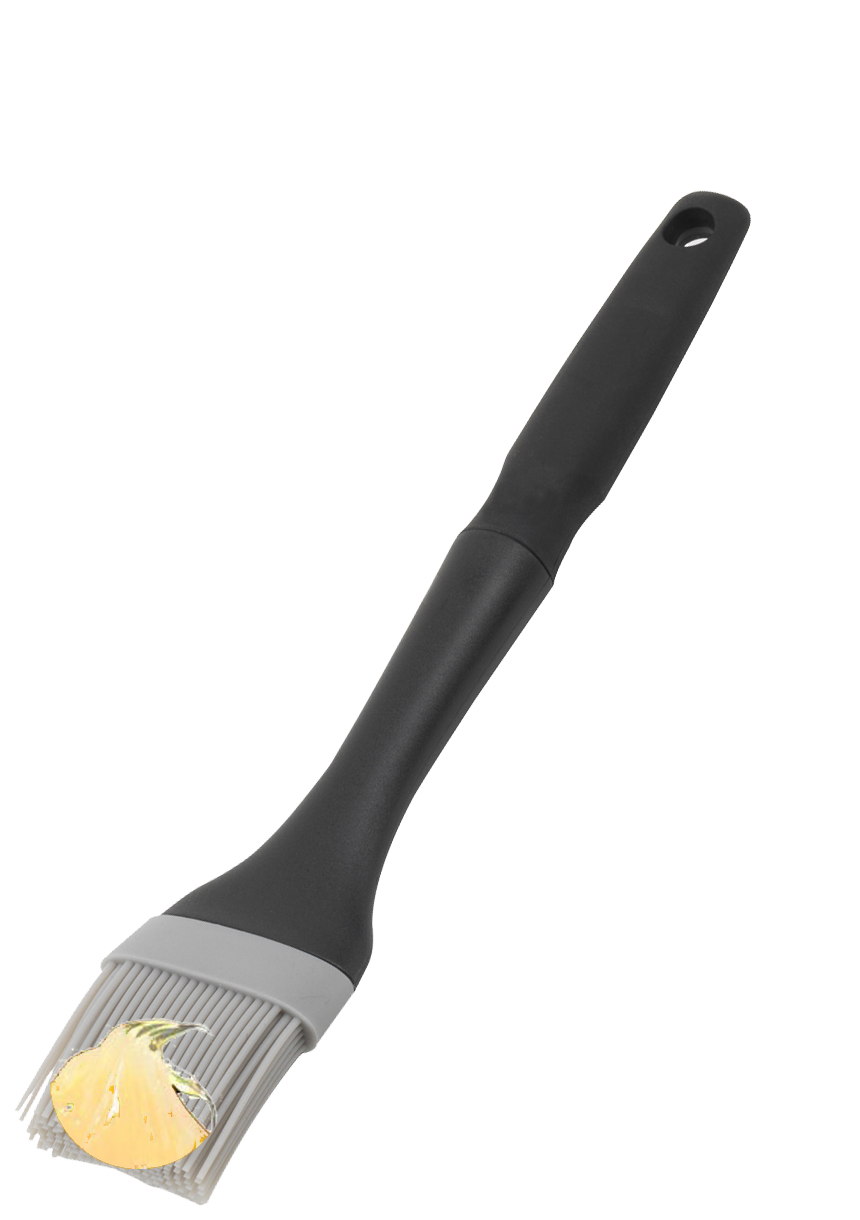
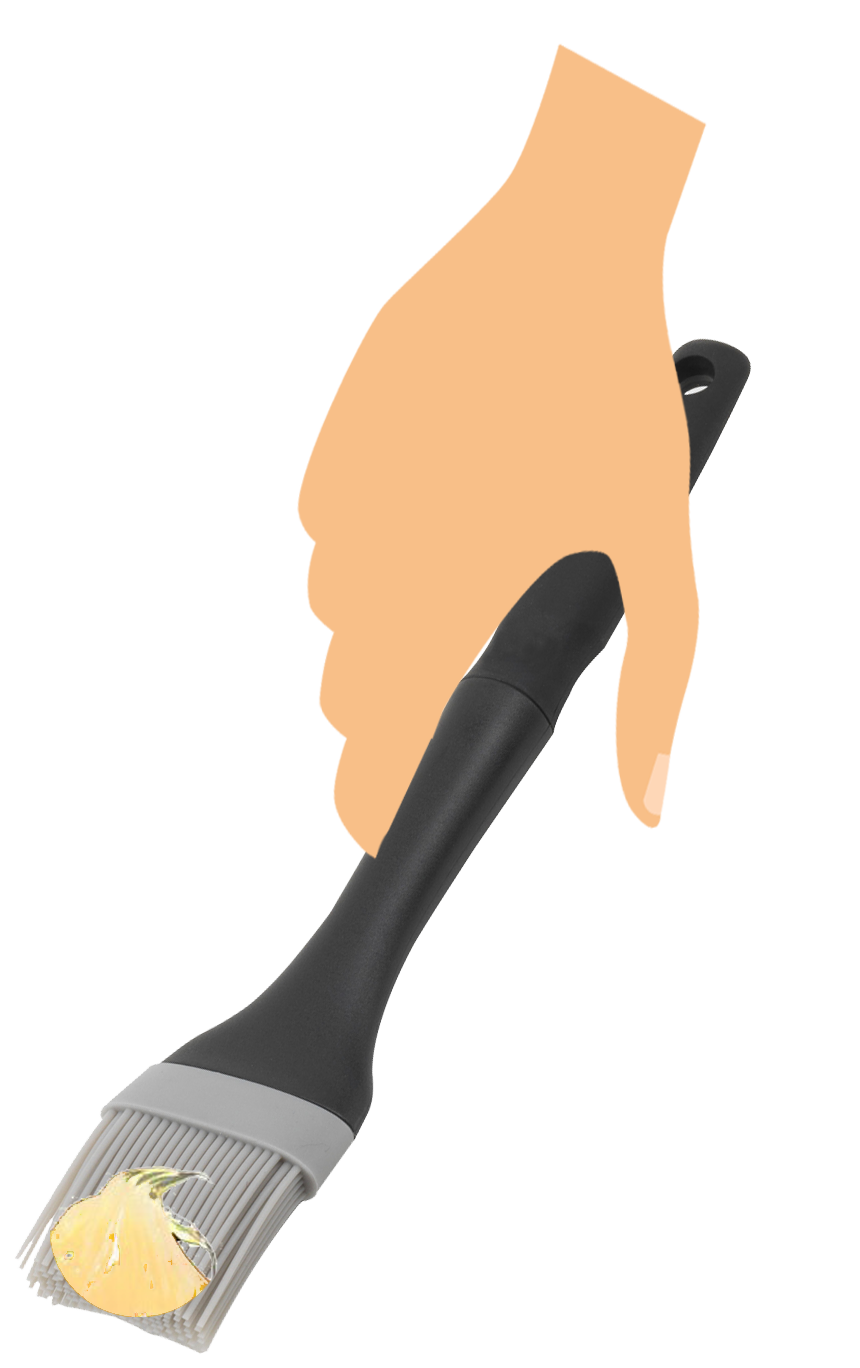
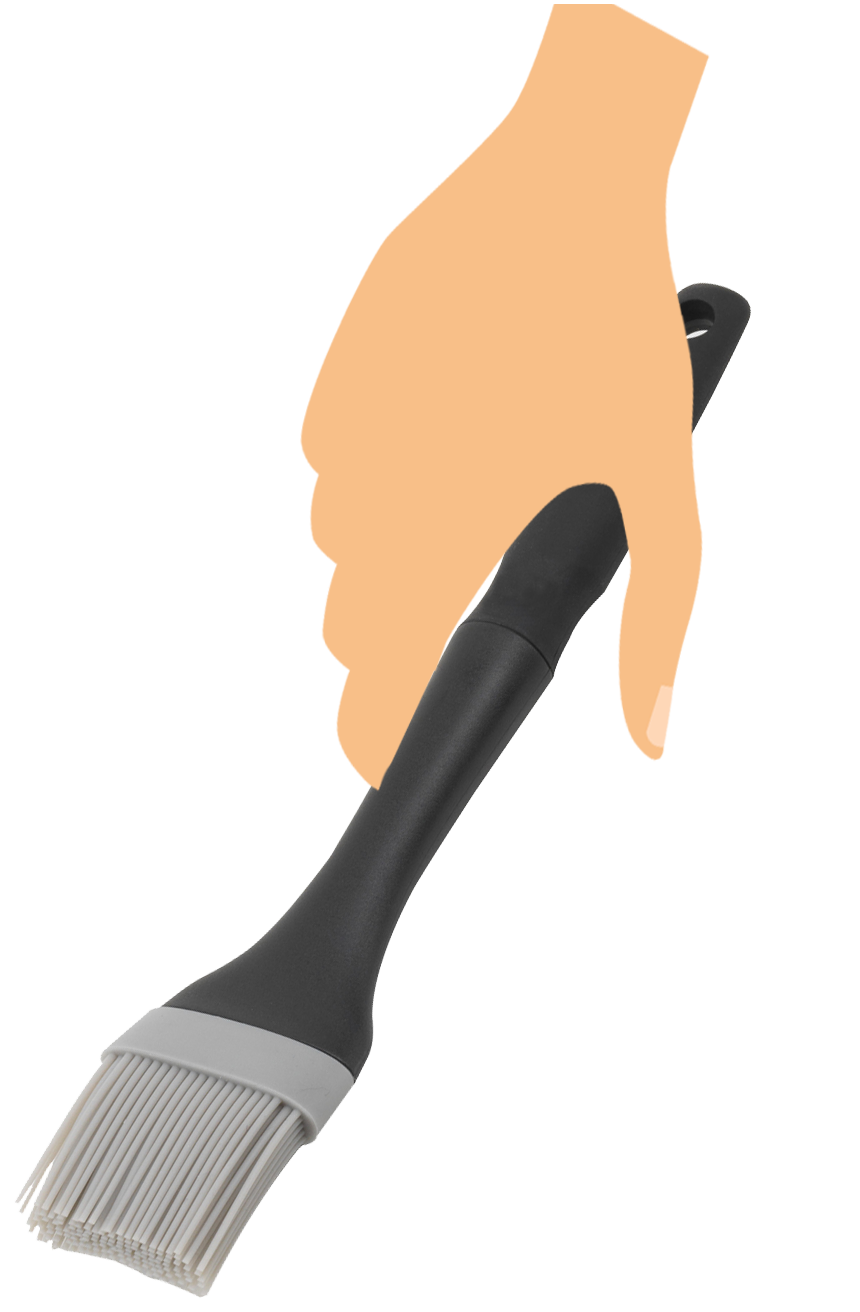
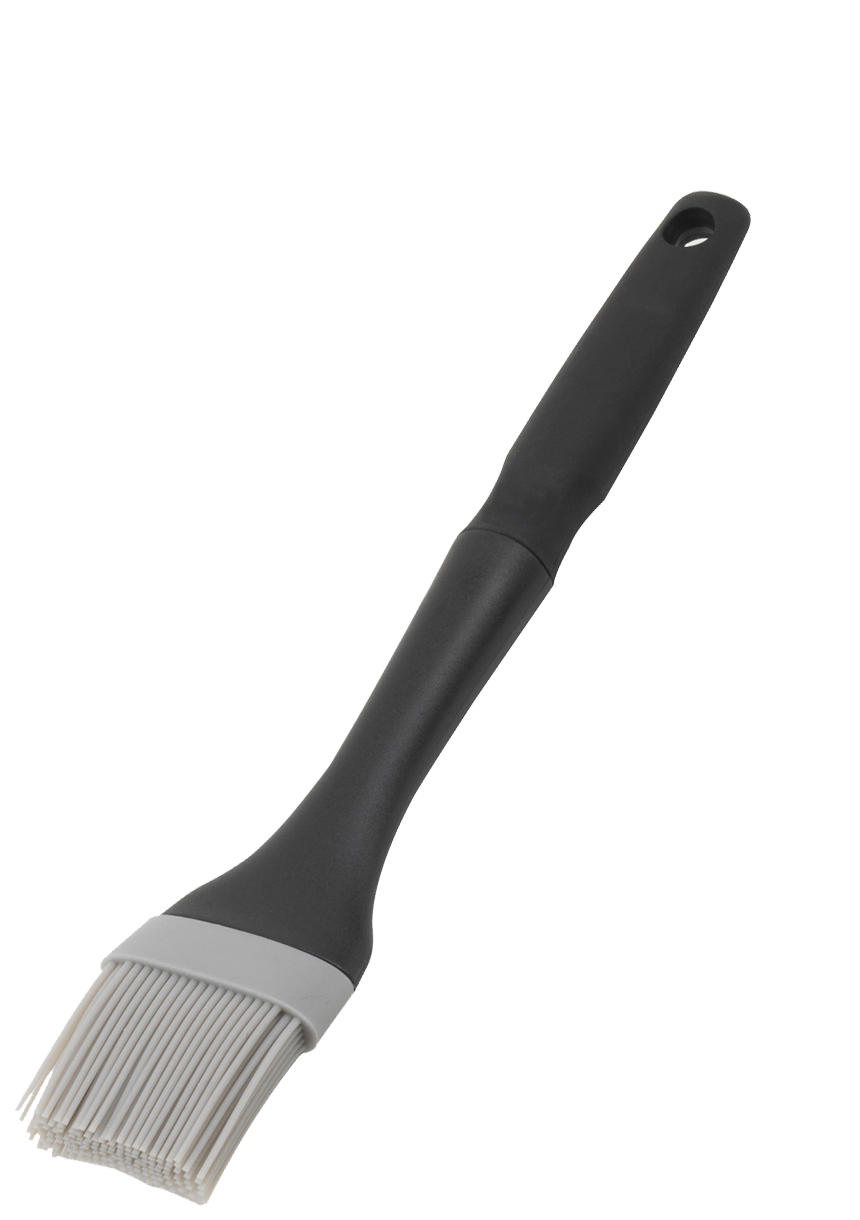
Step-1: (f) Click on add button to bring epoxy.
Step-1: (g) Click on brush to apply epoxy on the aluminium cantilever.
Step-1: (h) Click on add button to bring PZT patch.
Step-1: (i) Click on PZT patch to fix it on the aluminium cantilever.


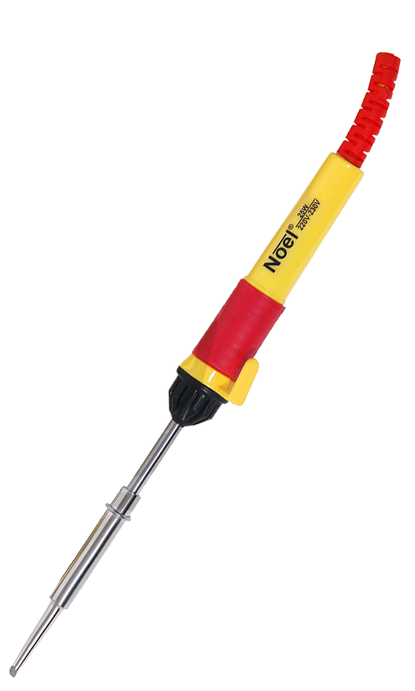
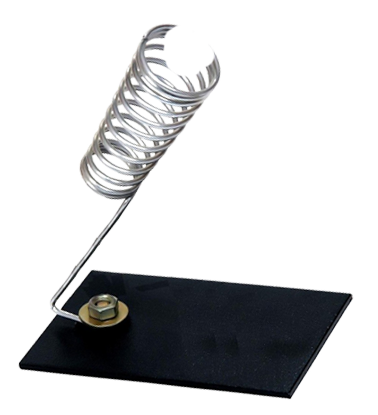
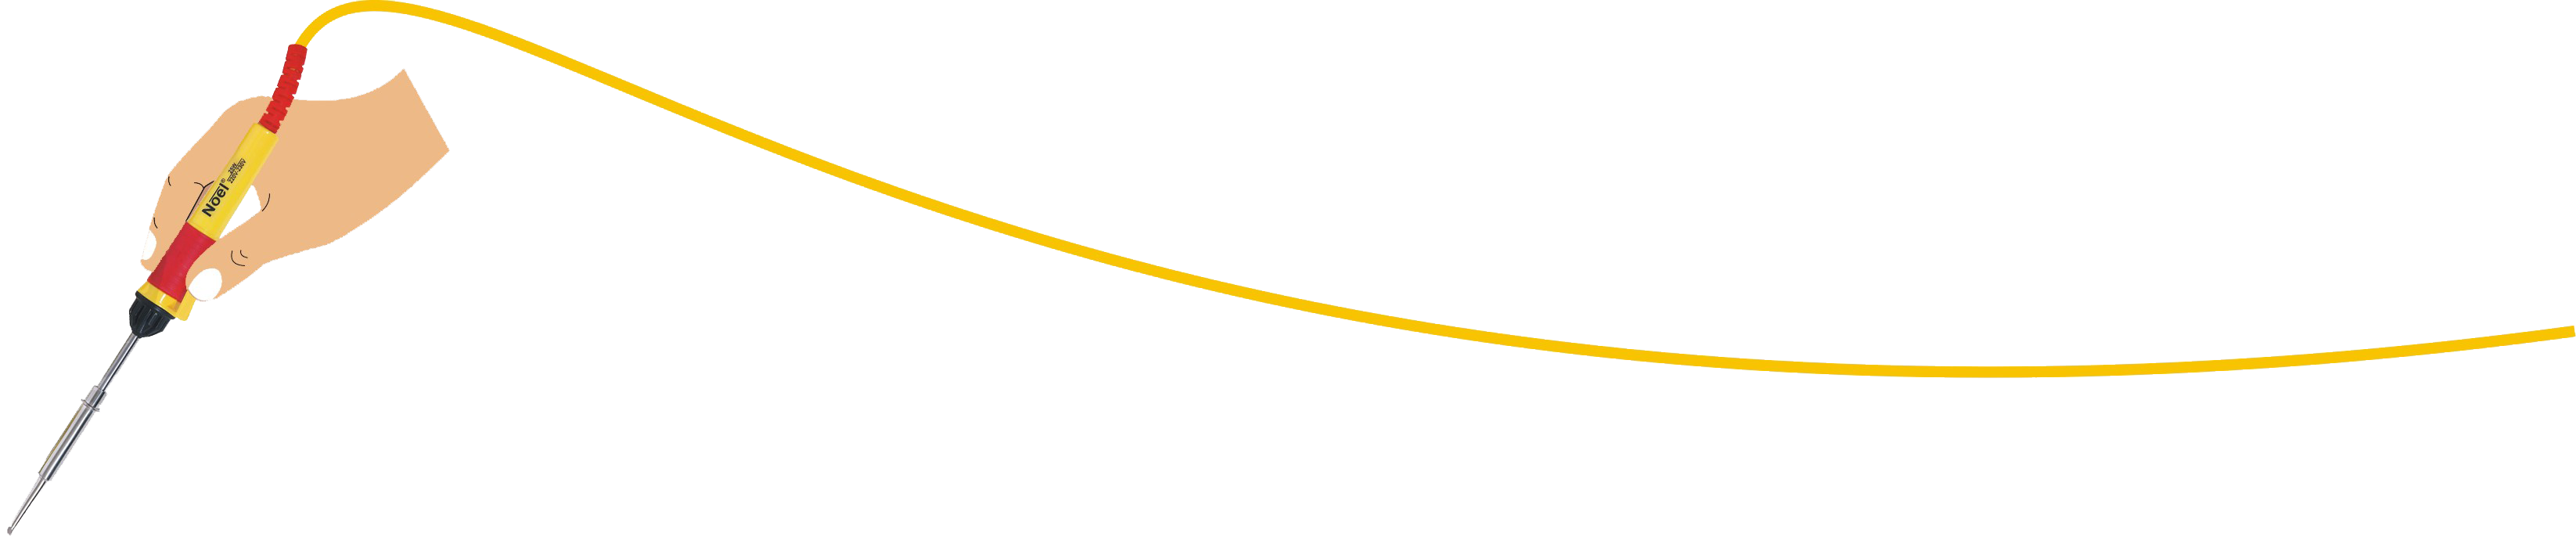
Step-2: (a) Click on add button to bring soldering iron.
Step-2: (b) Click on add button to bring wires.
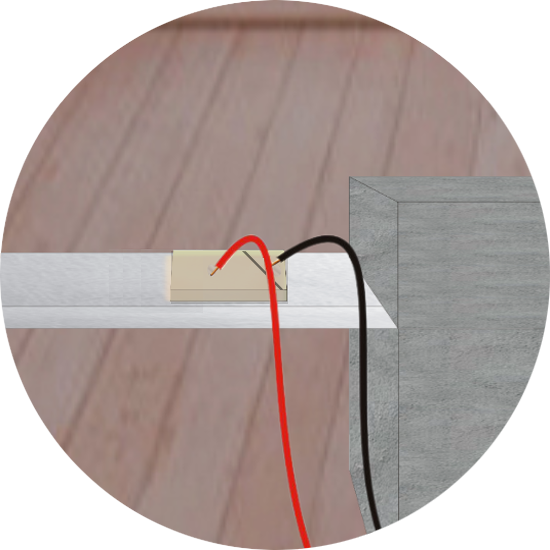
Step-2: (c) Click on red wire to place it on the PZT patch.
Step-2: (d) Click on black wire to place it on the PZT patch.
Step-2: (e) Click on PZT patch for zoom view.
Step-2: (f) Click on soldering iron for soldering.
Step-2: (g) Click on soldering iron to bring it back.
Step-2: (h) Click on add button to bring hammer.
Step-2: (i) Click on add button to bring digital multimeter.
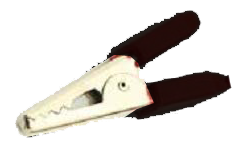
Step-2: (j) Click on black clip to attach wire with PZT patch's wire.
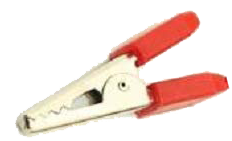
Step-2: (k) Click on red clip to attach wire with PZT patch's wire.
Step-2: (l) Switch on the power button of digital multimeter.
Step-2: (m) Click on hammer button to start animation.
Step-2: (n) Click on stop button to stop animation.


Step-3: Click on download data button.
Time:
No. of samples:
Select First
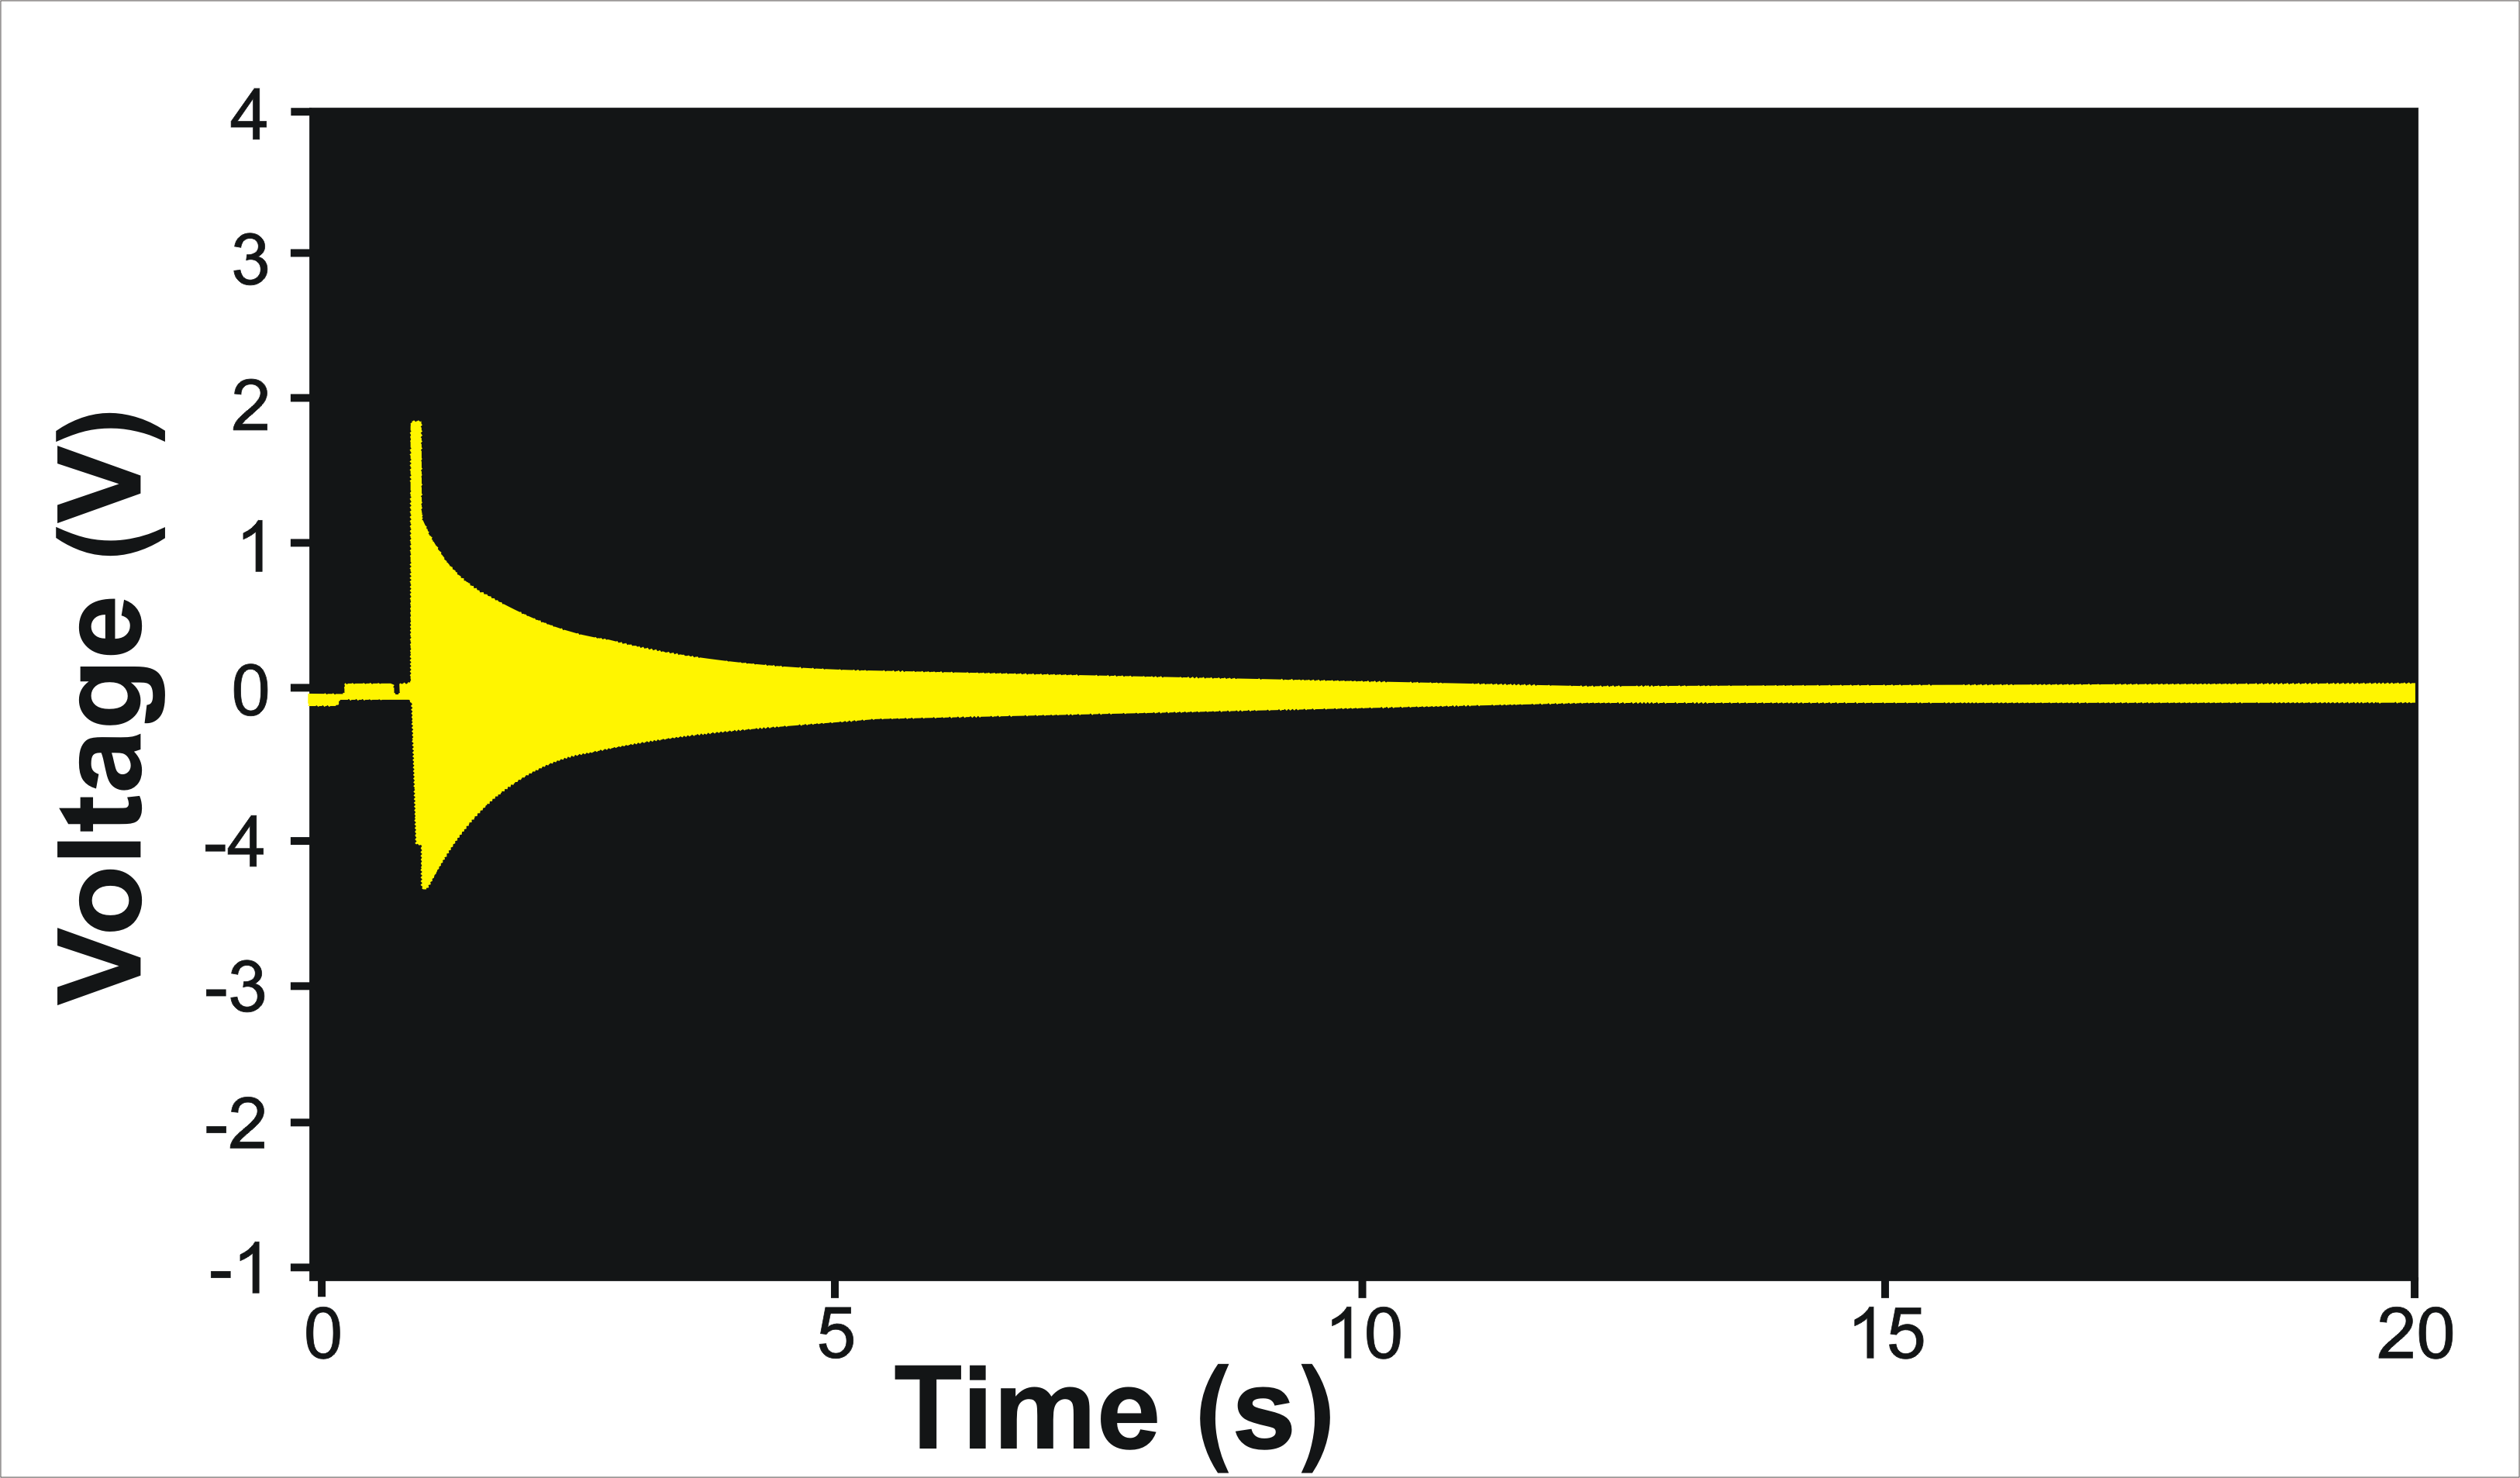
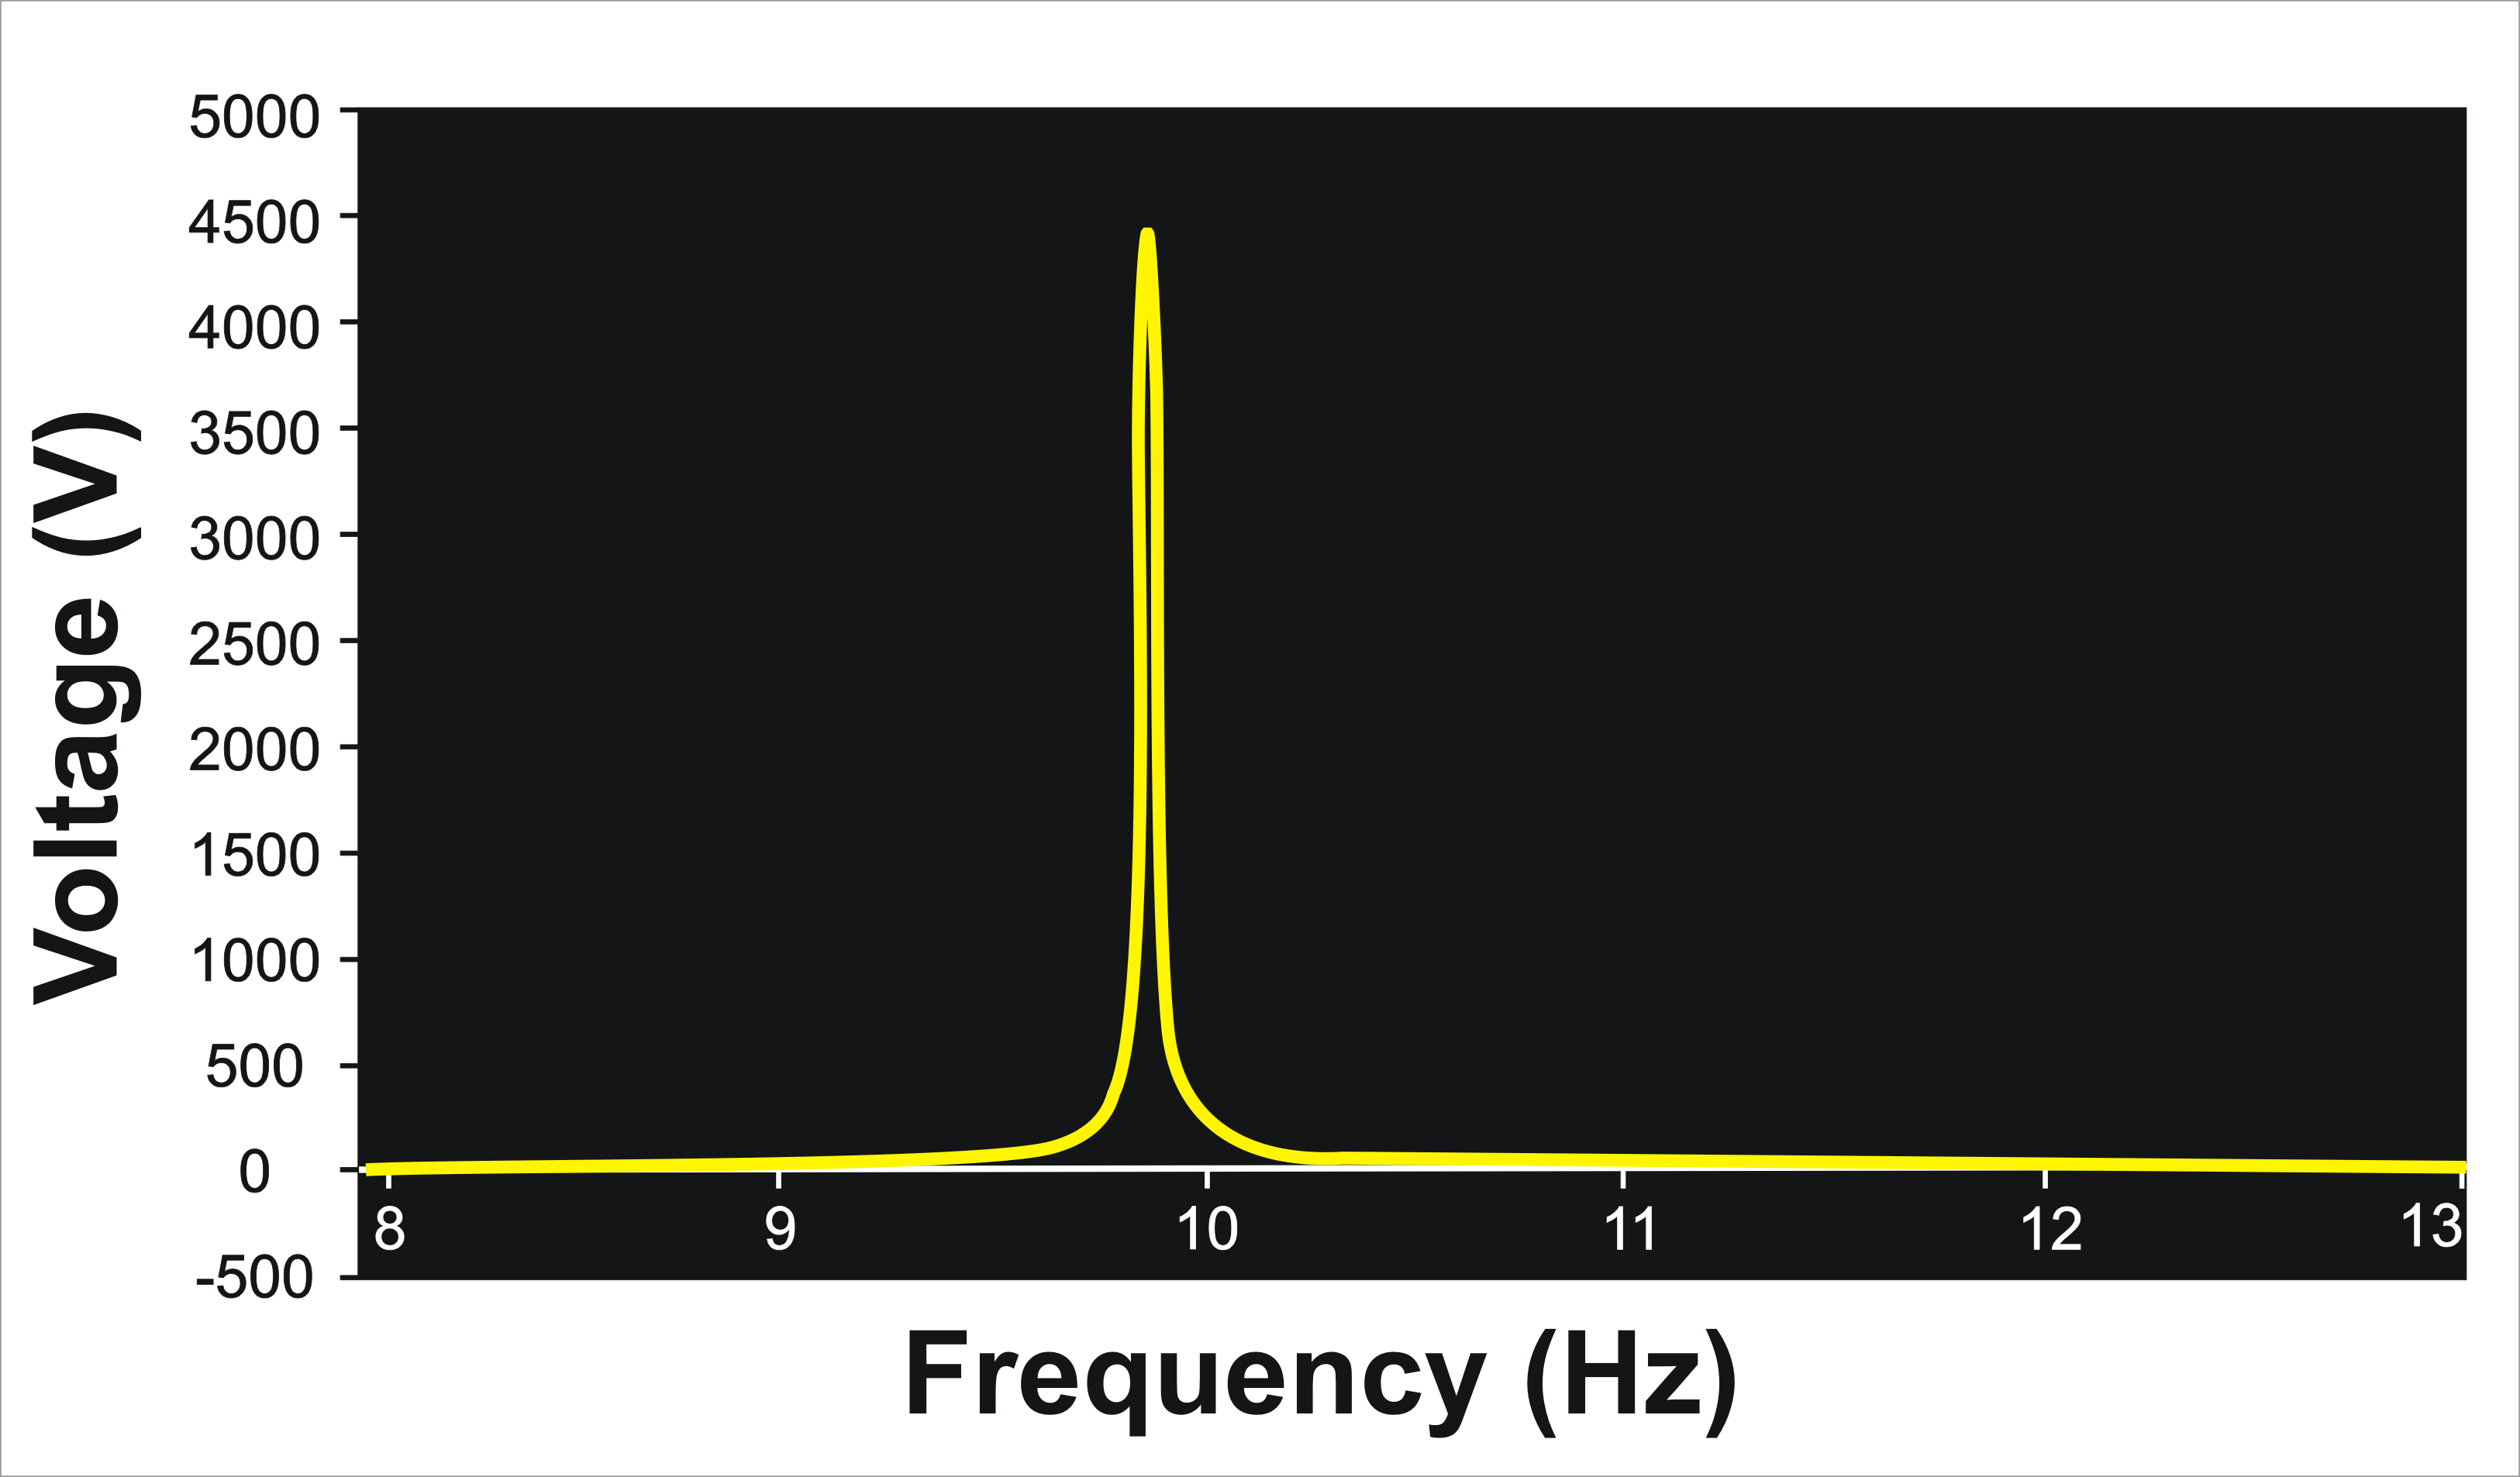

Note: Notice the highest peak in the graph and note it as the natural frequency.
Step-4: Calculate the natural frequency theoretically
 (Refer manual of experiment in reference tab)
Compare the calculated theoretical frequency with the frequency obtained through
(Refer manual of experiment in reference tab)
Compare the calculated theoretical frequency with the frequency obtained through
this experiment.
(Refer manual of experiment in reference tab)
Compare the calculated theoretical frequency with the frequency obtained through this experiment.
Thank you for performing the experiment
If you want to perform experiment in trigger mode Click here