Instructions :-
Click on 'START' button to start the experiment

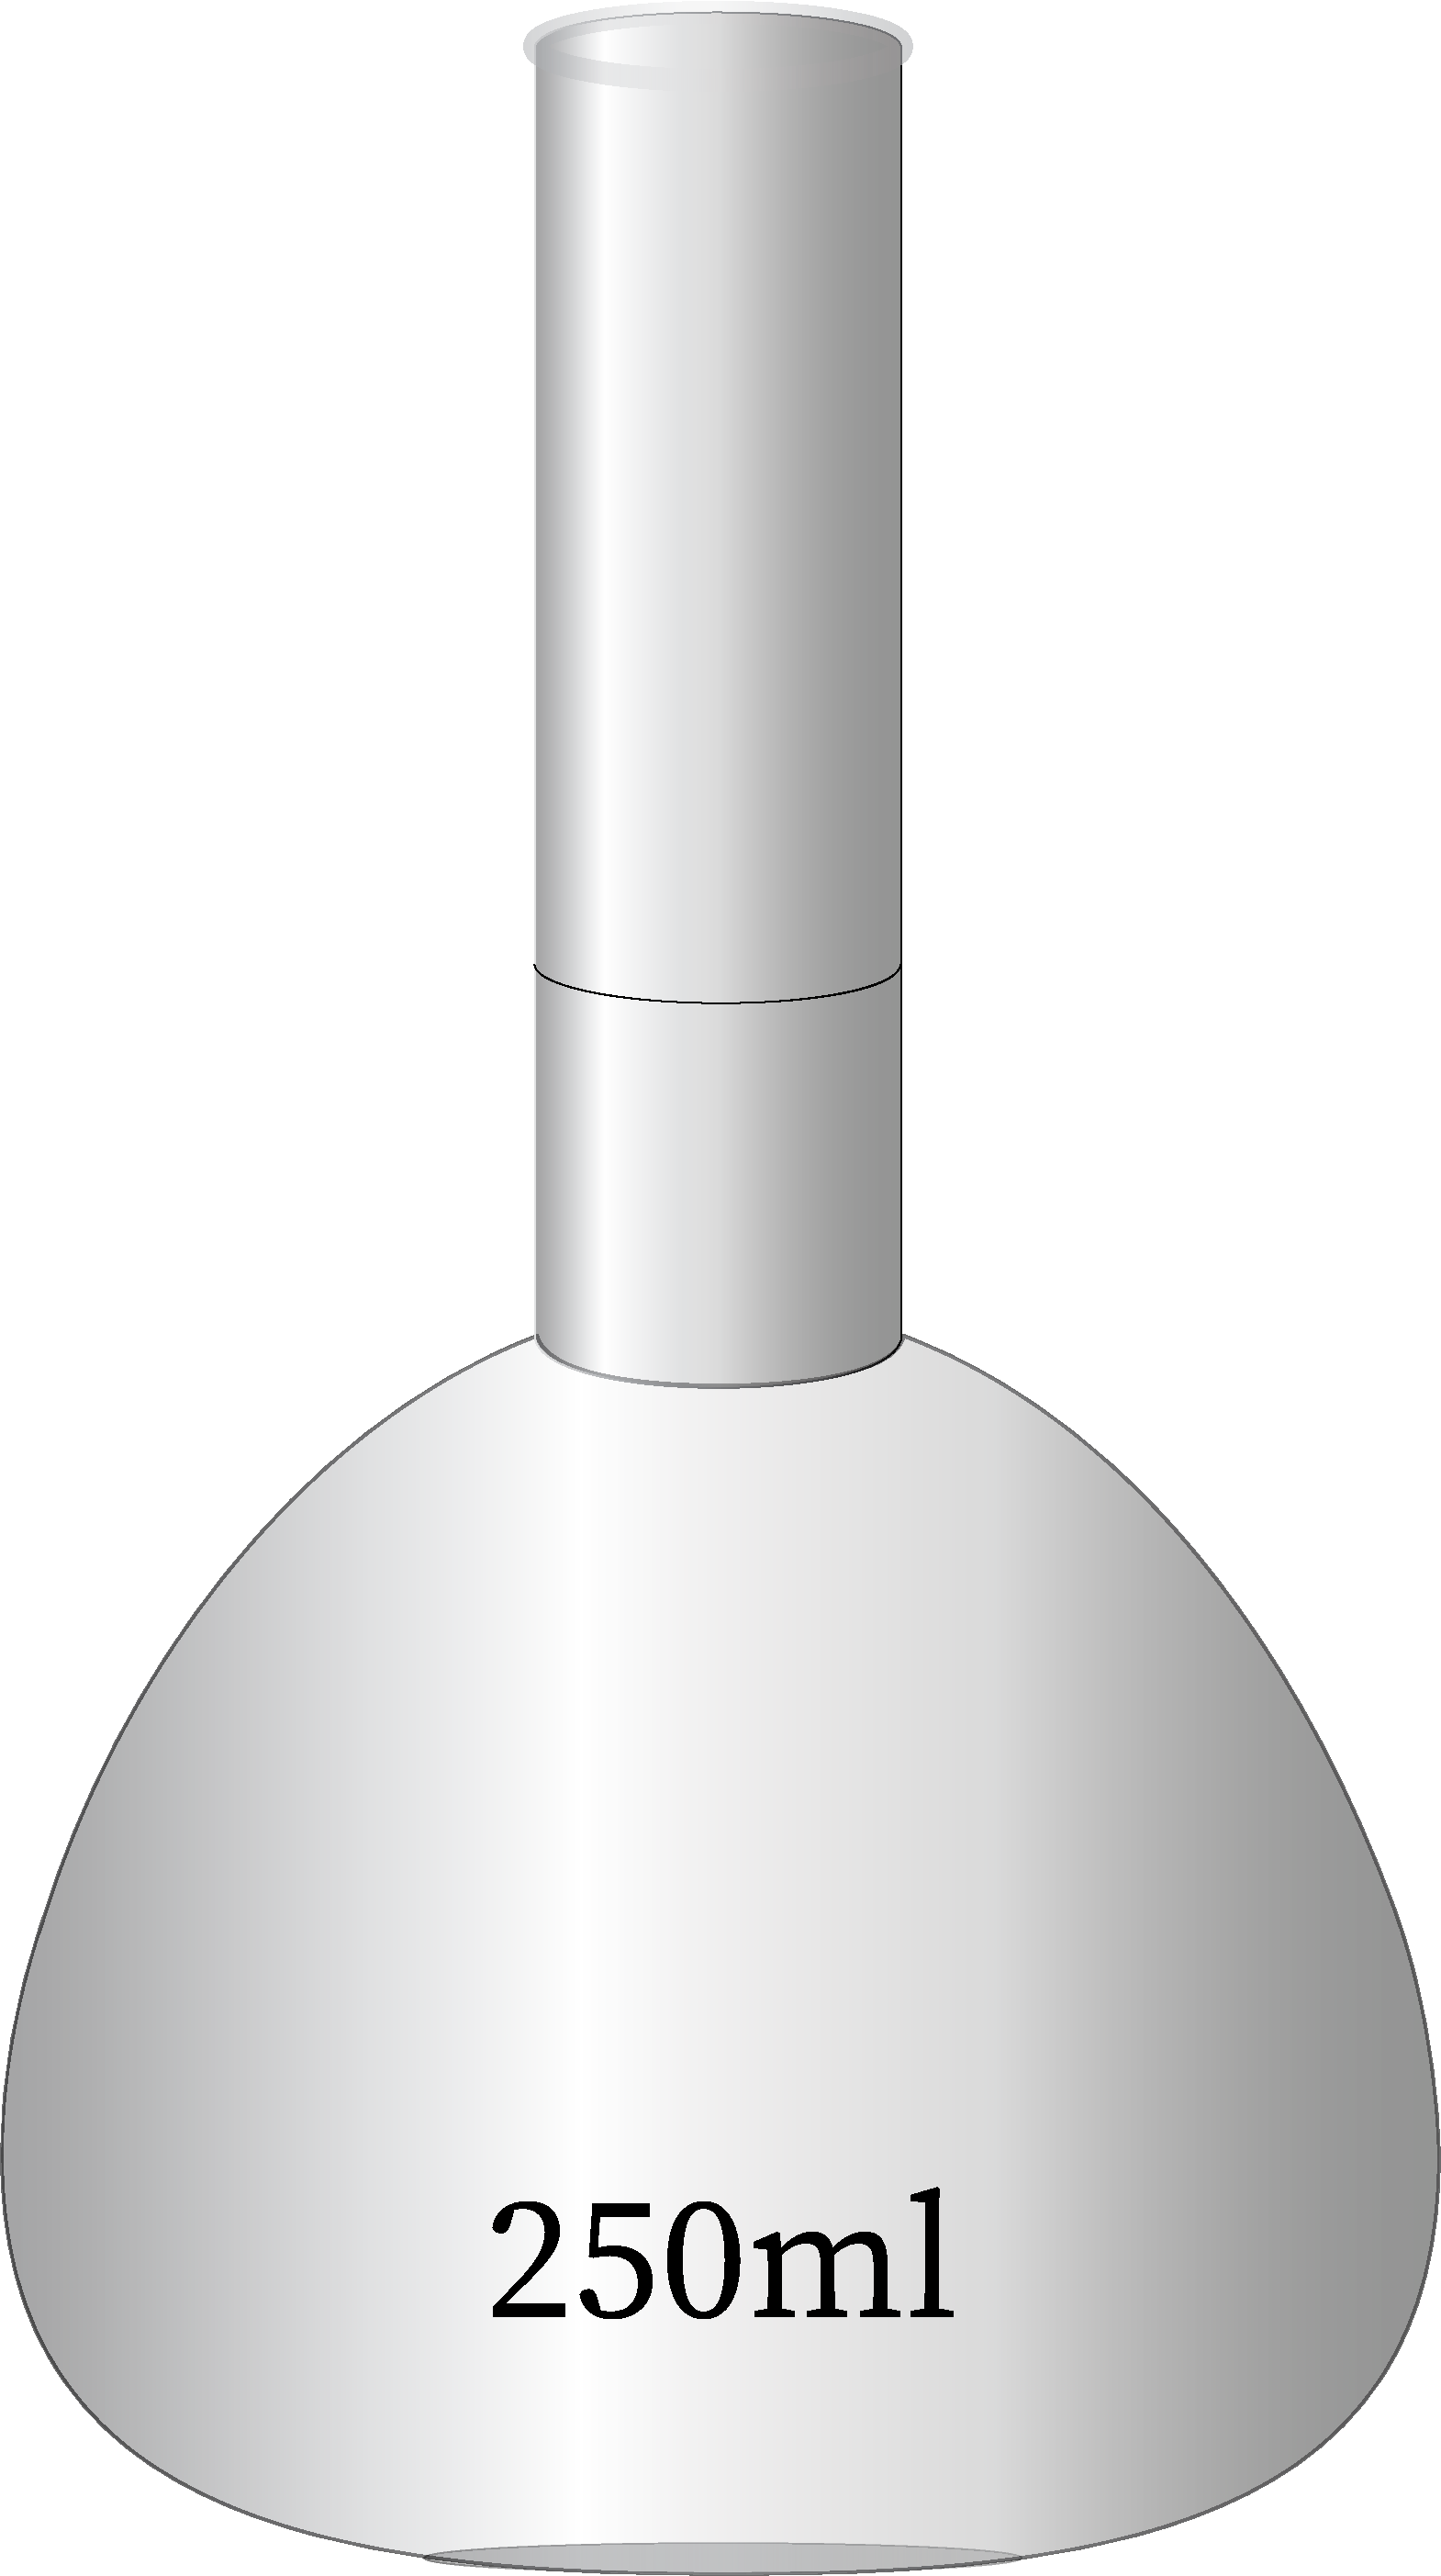
| Sample | Sample weight (W) |
Dilution volume (V2) |
Titre value (V3) |
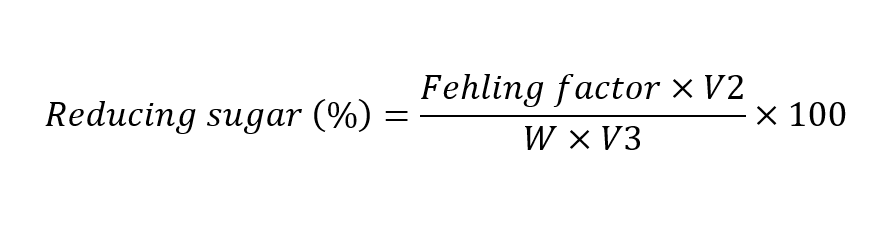
Reducing sugar (%) |
|---|---|---|---|---|
| T0 | 1.25 | 250 | 36 | |
| T1 | 1.25 | 250 | 27 | |
| T2 | 1.25 | 250 | 19 | |
| T3 | 1.25 | 250 | 15 | |
| T4 | 1.25 | 250 | 13 |
Reducing sugar (%) =
Right answer
Click me to see formula
Inference
Prepare the graph, Reducing sugar (%) Vs Time (min) for enzyme action, calculate its slope
Slope of graph=Rate of starch hydrolysis
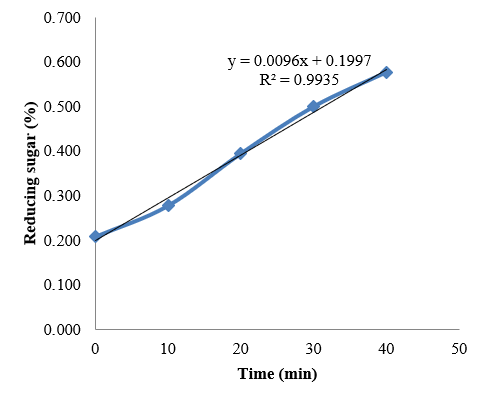
The above curve indicated that the percent reducing sugar increases in the starch solution as the time of enzyme treatment increases.
These observations clearly showing the starch hydrolysis rate increases with enzyme treatment time.
12x forward >>
MM : SS
00
:
00


00

T4
T3
T2
T1
T0


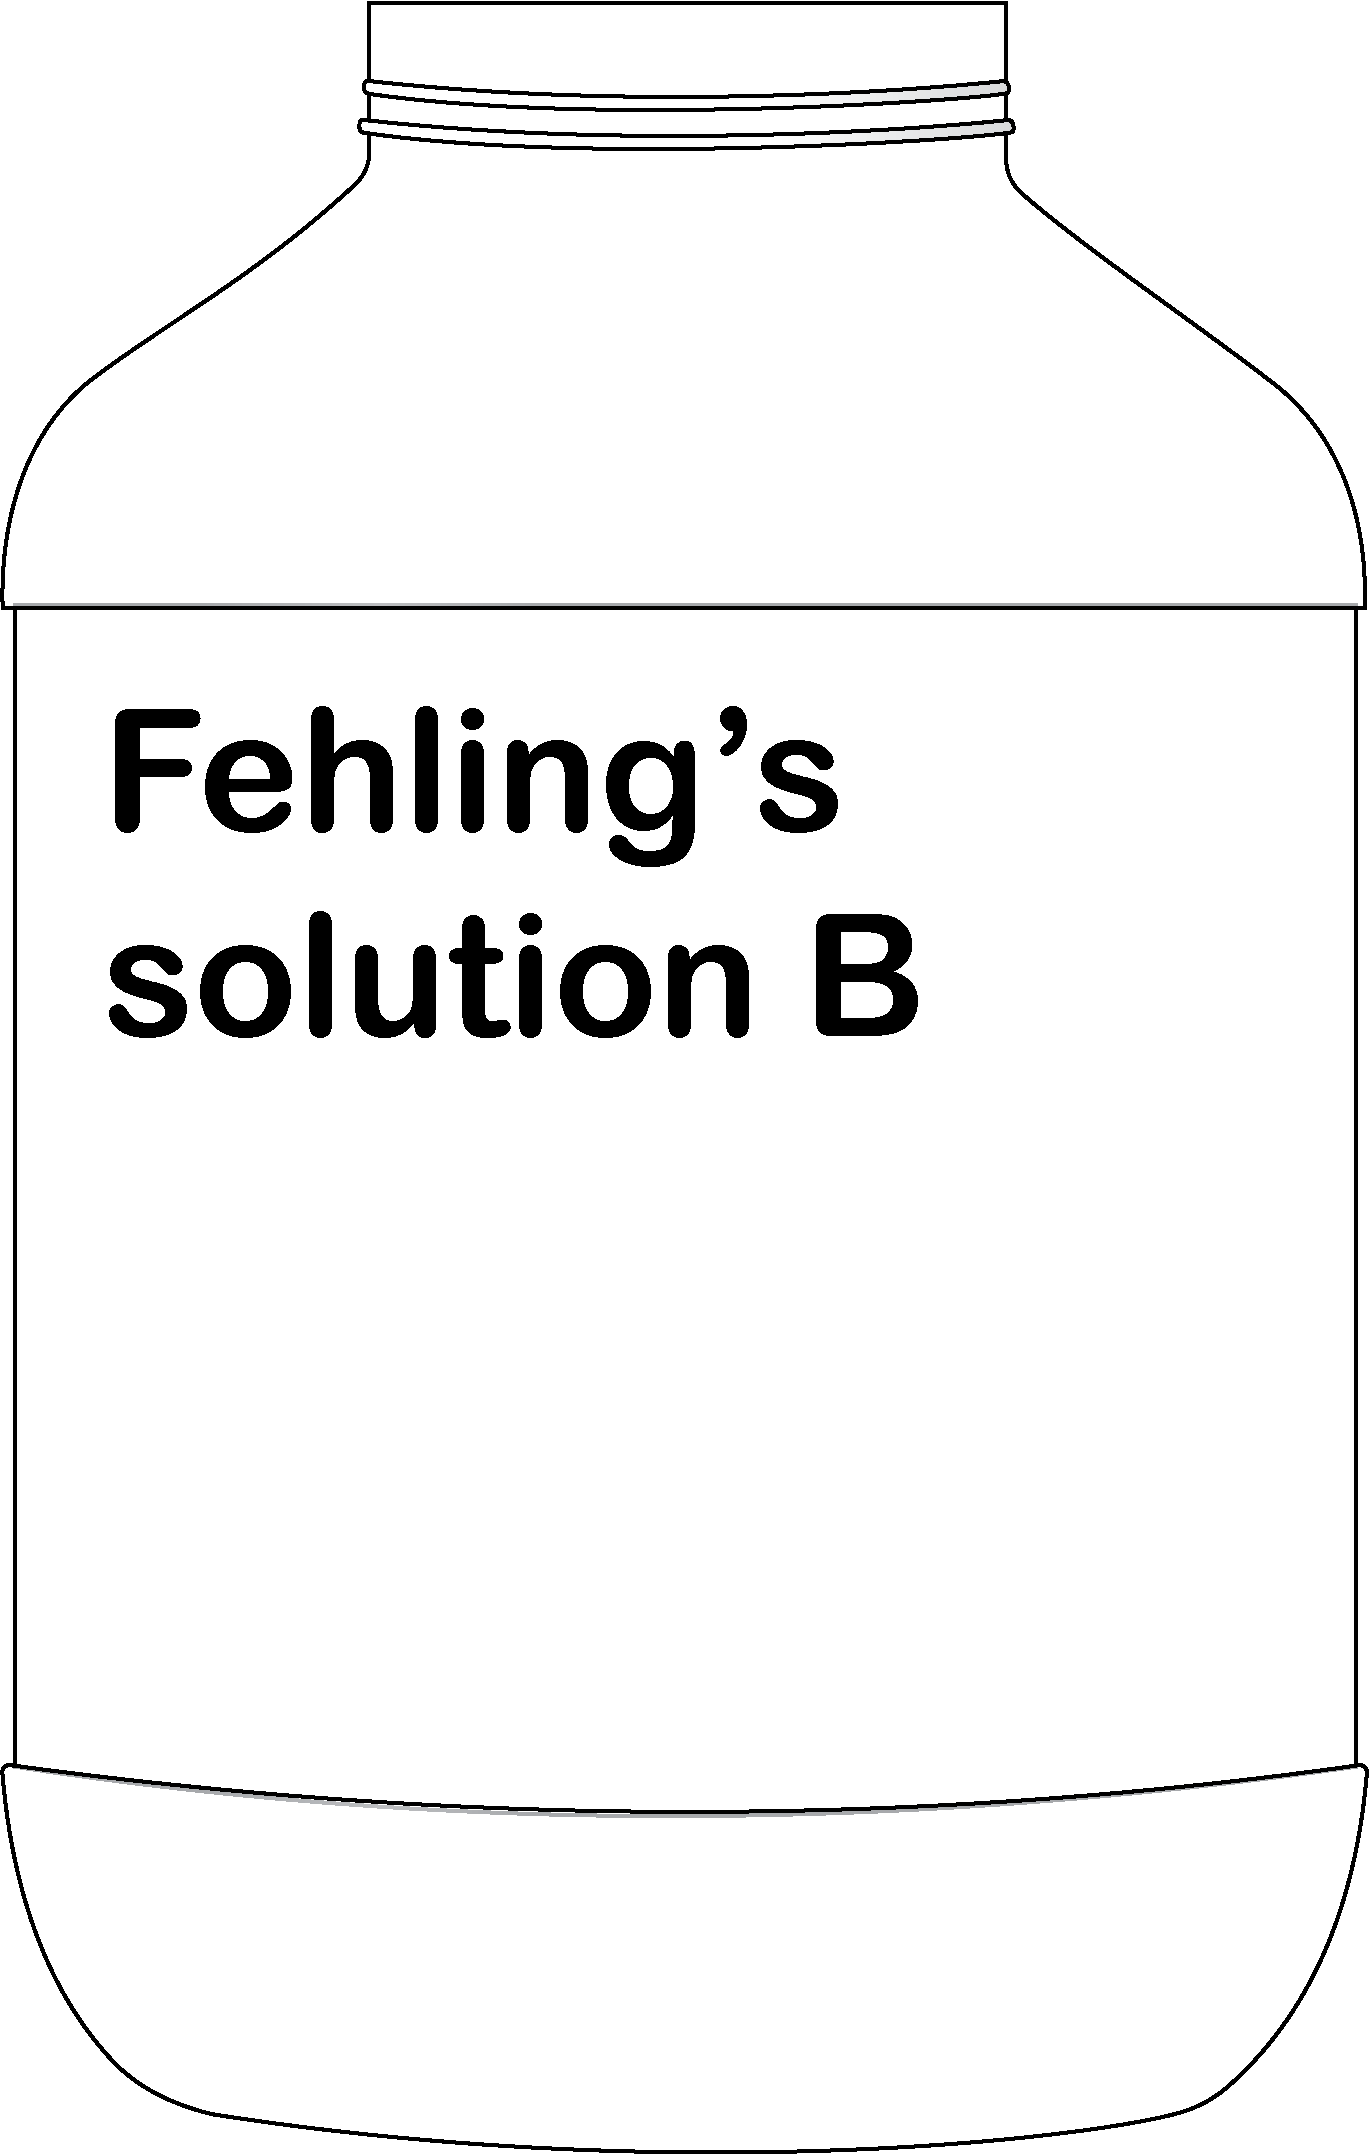
Fehling factor =
Right answer
Fehling factor =
Click me to see formula
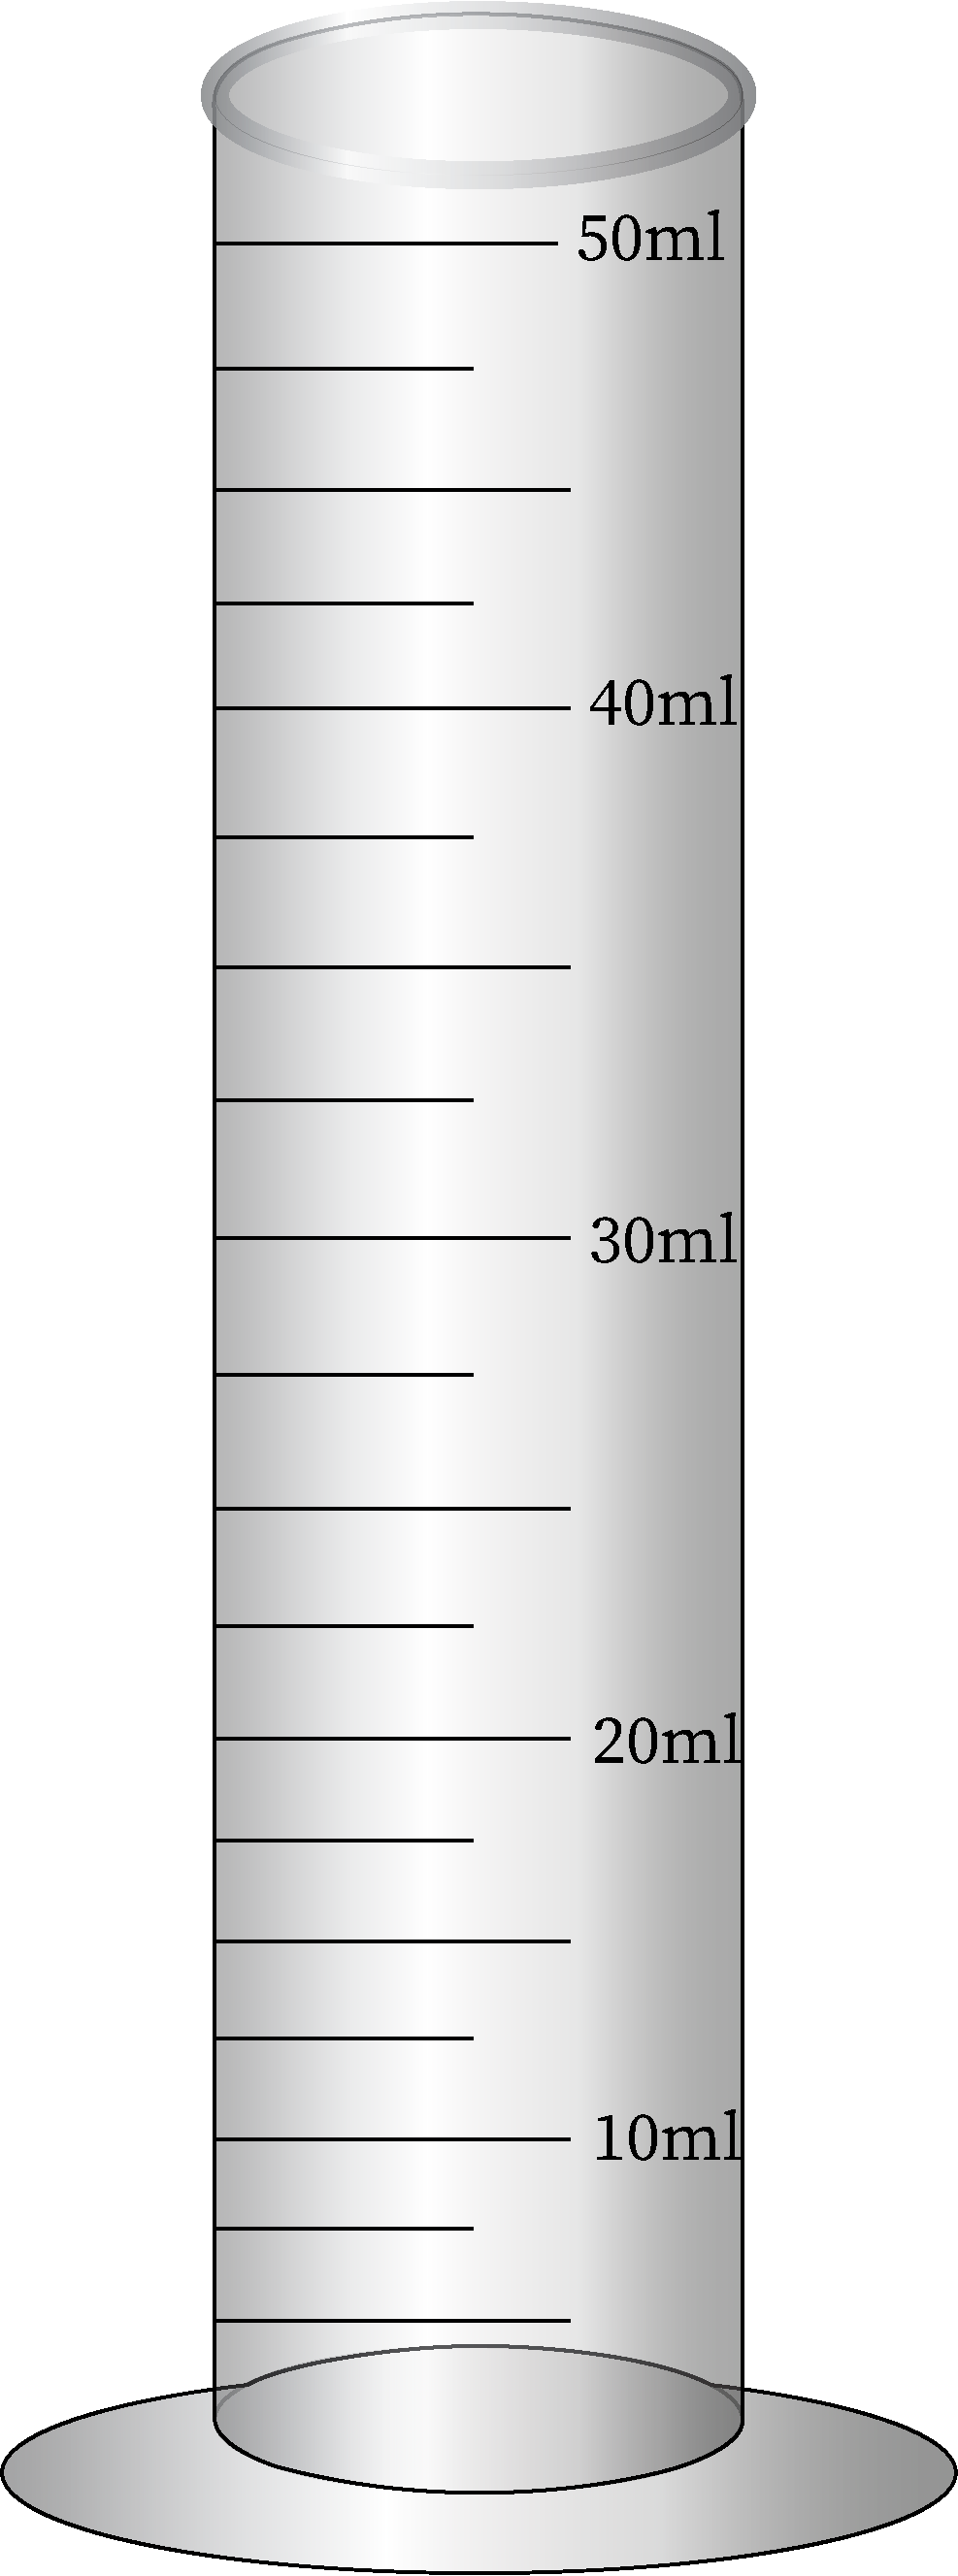
| Sample | Titrate volume (ml) |
|---|---|
| Fehling mixture | 0 |


| Sample | Titrate volume (ml) |
|---|---|
| T0 | 0 |
| T1 | 0 |
| T2 | 0 |
| T3 | 0 |
| T4 | 0 |


00.00