Demonstration of Solvent Effects on Fluorescence Spectra of a Fluorophore

×
Manual
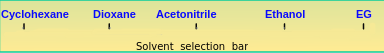
- Prepare five 1x10⁻⁵ M coumarin-138 solutions in five spectroscopy grade solvents, namely cyclohexane, dioxane, acetonitrile, ethyl alcohol and ethylene glycol. Such dilute solutions can be prepared via dilution from 1 x 10⁻⁴ M stock solutions in respective solvents. Here solutions in different solvents are shown on a solvent selection bar.
- The Absorption and Emission measurements with all the solutions are carried out one after another as follows.
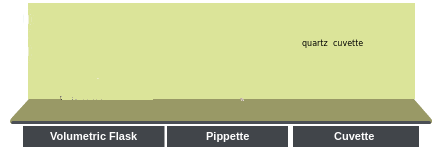
- To take a particular solution, click on the appropriate solvent on the solvent selection bar and then click on the volumetric flask containing the solution.
- Click on the quartz cuvette (path length, 1 cm ×1 cm) to take it to the instrument table. Quartz cuvettes for spectrophotometric measurements are transparent only on two opposite sides, unlike the all-side transparent quartz cuvettes used for fluorescence measurements.
- Click on the Pasteur pipette to collect about 3mL of the expeimental solution which will be transferred into the quartz cuvette.
- Click on the pipette to draw the solution into it.
- Click on the pipette to take it out of the volumetric flask.
- Click on the pipette again to transfer the solution into the cuvette.
- To start the absorption spectral scan, click on the pop-up “Start Absorption Measurement”.
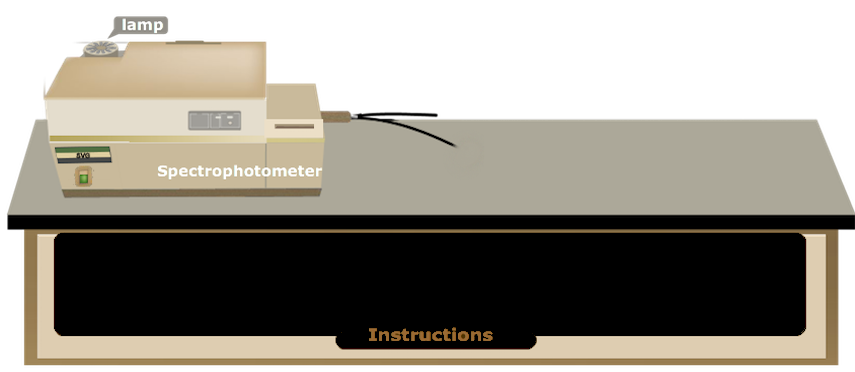
- Turn on the spectrophotometer by clicking on the power button. In real operation, it takes approx. 30 min for initialization of the instrument.
- Open the lid of the sample chamber of the spectrophotometer by clicking on the lid for placing the sample in the cell-holder.
- Click on the cuvette to place it in the sample holder. One has to use pure solvent as the sample blank or reference in this measurement. Here a double beam spectrophotometer is shown.
- Close the lid of the sample chamber by clicking on it.
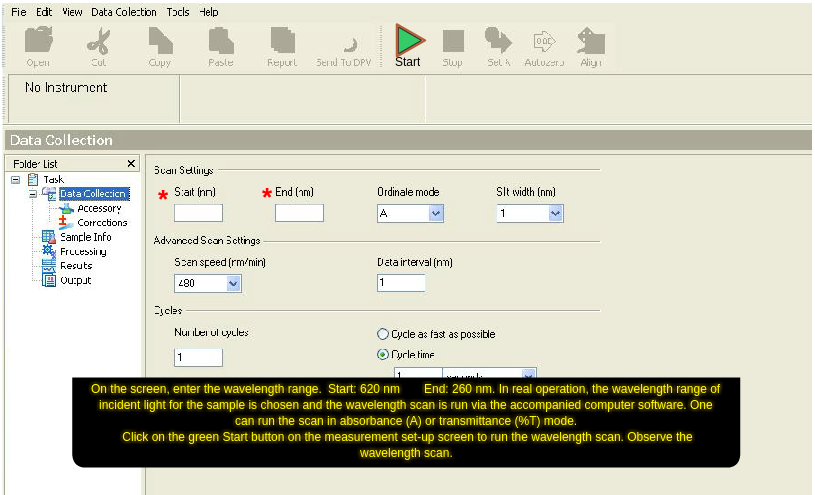
- Open the measurement set-up screen by clicking on the absorption measurement icon on the computer monitor.
- On the screen, enter the wavelength range. Start: 430 nm End: 275 nm. In real operation, the wavelength range of incident light for the sample is chosen and the wavelength scan is run via the accompanied computer software. One can run the scan in absorbance (A) or transmittance (%T) mode.
- Click on the green 'Start' button on the measurement set-up screen to run the wavelength scan. Observe the wavelength scan.
- Click on 'Close' button when spectral scan is complete. In real operation, the scan data are stored in the computer. The instrument stores data and therefore asks for the Sample File name. One enters a file name to save the data.
- To take the cuvette out of the sample chamber, first click on the sample chamber lid to open it and then on the cuvette.
- Click on the lid of the sample chamber to close it.
- Click on the pop-up: “Start Fluorescence measurement”.
- Turn on the spectrofluorimeter by clicking on the power button. In real operation, it takes approx. 30 min for initialization of the instrument.
- Click on the spectrophotometric quartz cuvette to transfer its content into an all-side-transparent quartz cuvette of path length 1 cm ×1 cm for the fluorescence measurement.
- Run the Emission Spectral Scan of the sample on a spectrofluorimeter as follows.
- Open the lid of the sample chamber of the spectrofluorimeter by clicking on the lid for placing the sample.
- Click on the cuvette to place it in the sample holder.
- Close the lid of the sample chamber by clicking on the lid.
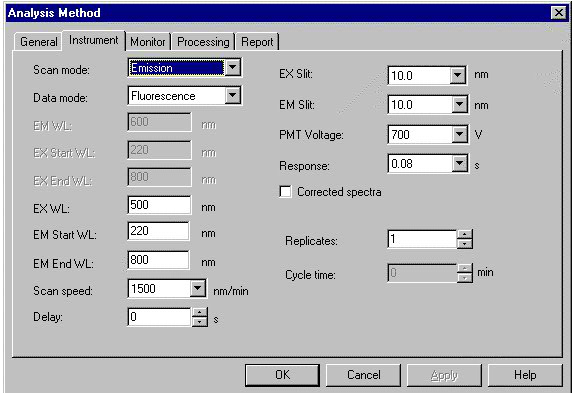
- Open the instrument set-up screen by clicking on the fluorescence measurement icon on the computer monitor.
- Select the Emission Scan Mode on the screen.
- On the screen, enter the Excitation wavelength: 360 nm, Emission Start Wavelength: 365 nm and Emission End wavelength: 600 nm. One chooses the Excitation Slit(nm) and Emision Slit(nm) values (here 10 nm/10 nm) and the scan speed value (here "medium") also.
- To run the wavelength scan for emission spectrum, click on 'OK' button on the set-up screen. One has to be sure that the solvent blank does not fluoresce in the wavelength range of interest.
- Click on 'Close' button when spectral scan is complete. In real operation, the scan data are stored in the computer. The instrument stores data and therefore asks for the Sample File name. One enters a file name to save the data.
- To take the cuvette out of the sample chamber, first click on the sample chamber lid to open it and then on the cuvette.
- Close the lid of the sample chamber by clicking on the lid.
- Click on 'Reset' button to start over the measurements.
- Repeat the Absorption and Emission measurements with all the solvents by clicking on the solvent selection bar first and then on the volumetric flask containing the solution.
- Collect all data by clicking on the Data tab.
- Find out the maximum absorption and emission wavelengths for all the solvents and tabulate them along with the solvent dielectric constants and refractive indices values. Determine the absorption and fluorescence maxima in wave-number/cm-1 unit for all the solvents.
- Calculate the solvent polarity function (Δf) from solvent dielectric constants and refractive indices values.
- Plot Stokes shifts (in wave-number unit, cm-1) as a function of the solvent polarity function (Δf).
- Discuss the characteristics of the plot.
- Calculate the excited state dipole moment of coumarin-138