Determination of Fluorescence Quantum Yield of a Fluorophore
-->
×
Manual
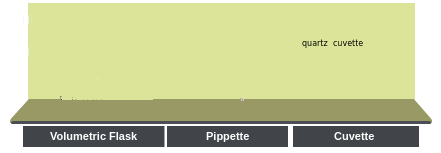
- Prepare 1 × 10⁻⁵M solutions of rhodamine 6G and rhodamine B by dissolving them in spectroscopy grade ethanol. For the measurements here the solution concentrations are diluted such that the absorbance values at the excitation wavelength are below 0.05 (here 0.032 for both the solutions). This is required for avoiding the inner filter effects. Low concentrations are prepared via dilution of higher concentration stock solutions. Here the solutions are shown on a bar.
- Carry out the absorption and fluorescence measurements of the solutions as follows.
- To select a solution, click on the solution on the selection bar. First select rhodamine B solution.
- Click on the volumetric flask containing rhodamine B solution to take it to the instrument table.
- Click on the quartz cuvette (path length, 1 cm ×1 cm) to take it to the instrument table. Quartz cuvettes for spectrophotometric measurements are transparent only on two opposite sides, unlike the all-side transparent quartz cuvettes used for fluorescence measurements.
- Click on the 5 mL‑capacity pipette to collect 3 mL of the experimental solution which will be transferred into the quartz cuvette. In real operation, one has to set the volume to 3 mL in the pipette and an appropriate tip should be attached prior to dipping it in the solution.
- Click on the pipette to draw the solution into it.
- Click on the pipette to take it out of the volumetric flask.
- Click on the pipette again to transfer the solution into the cuvette.
- To start the absorption spectral scan, click on the pop-up “Start Absorption Measurement”.
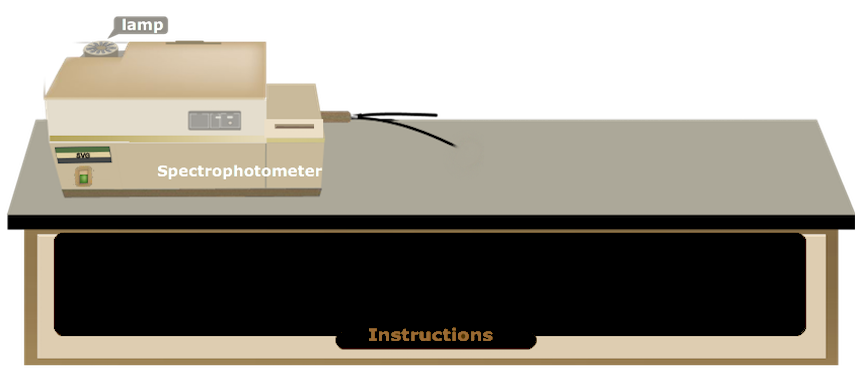
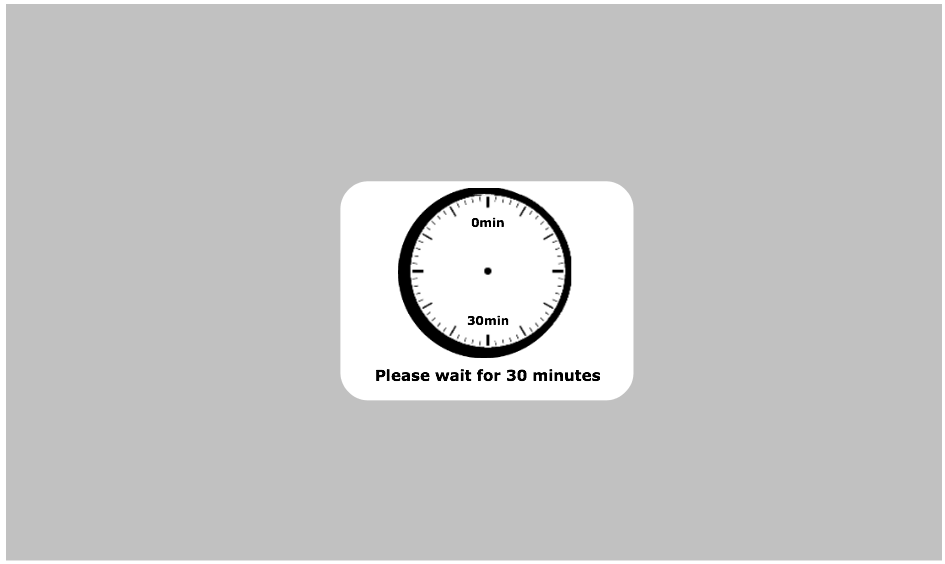
- Turn on the spectrophotometer by clicking on the power button. In real operation, it takes approx. 30 min for initialization of the instrument.
- Open the lid of the sample chamber of the spectrophotometer by clicking on the lid for placing the sample in the cell-holder.
- Click on the cuvette to place it in the sample holder. One has to use pure solvent as the sample blank or reference in this measurement. Here a double beam spectrophotometer is shown.
- Close the chamber lid by clicking on it.
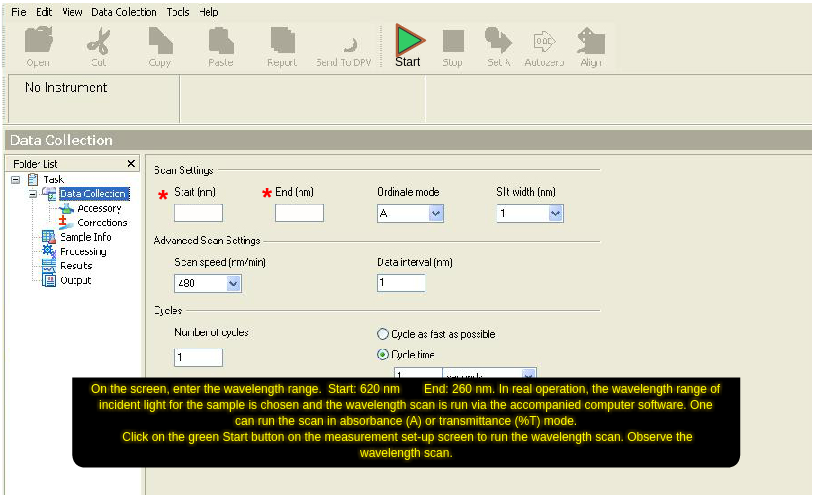
- Open the measurement set-up screen by clicking on the absorption measurement icon on the computer monitor.
- On the screen, enter the wavelength range. Start: 580 nm End: 460 nm. In real operation, the wavelength range of incident light for the sample is chosen and the wavelength scan is run via the accompanied computer software. One can run the scan in absorbance (A) or transmittance (%T) mode.
- Click on the green 'Start' button on the measurement set-up screen to run the wavelength scan. Observe the wavelength scan.
- Click on 'Close' button when spectral scan is complete. In real operation, the scan data are stored in the computer. The instrument stores data and therefore asks for the Sample File name. One enters a file name to save the data.
- To take the cuvette out of the sample chamber, first click on the sample chamber lid to open it and then on the cuvette.
- Close the sample chamber lid by clicking on it.
- Click on the pop-up: “Start Fluorescence measurement”.
- Turn on the spectrofluorimeter by clicking on the power button. In real operation, it takes approx. 30 min for initialization of the instrument.
- Click on the spectrophotometric quartz cuvette to transfer its content into an all-side-transparent quartz cuvette of path length 1 cm ×1 cm for the fluorescence measurement.
- Run the Emission Spectral Scan of the sample on a spectrofluorimeter as follows.
- For placing the sample in the instrument, open the lid of the sample chamber of the spectrofluorimeter by clicking on the lid.
- To place the cuvette in the sample holder, click on the cuvette.
- Close the lid of the sample chamber by clicking on the lid.
- Open the instrument set-up screen by clicking on the fluorescence measurement icon on the computer monitor.
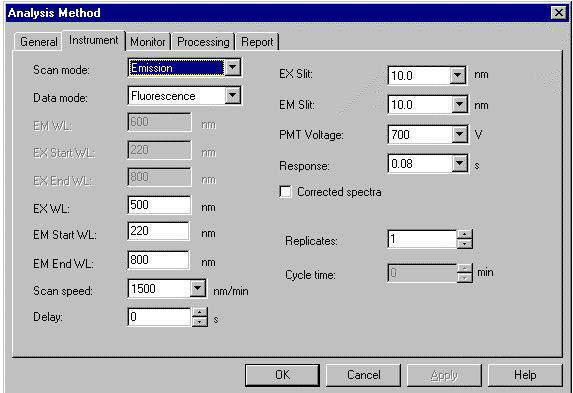
- Select the Emission Scan Mode on the screen.
- On the screen, enter the Excitation wavelength: 535 nm, Emission Start Wavelength: 500 nm and Emission End wavelength: 680 nm. One chooses the Excitation Slit(nm) and Emission Slit(nm) values (here 2.5 nm/2.5 nm) and the scan speed value (here “medium”) also.
- To run the wavelength scan for emission spectrum, click on 'OK' button on the set-up screen. One has to be sure that the solvent blank does not fluoresce in the wavelength range of interest.
- Click on 'Close' button when spectral scan is complete. In real operation, the scan data are stored in the computer. The instrument stores data and therefore asks for the Sample File name. One enters a file name to save the data.
- To take the cuvette out of the sample chamber, first click on the sample chamber lid to open it and then on the cuvette.
- Close the lid of the sample chamber by clicking on the lid.
- Click on 'Reset' button to start over the measurements.
- Repeat the Absorption and Emission measurements with the reference sample, rhodamine 6G solution, by selecting it and then by clicking on the volumetric flask containing rhodamine 6G solution. For rhodamine 6G: On the absorption measurement screen, enter the wavelength range: Start: 580 nm; End: 440 nm. On the emission measurement screen, enter the Excitation wavelength: 535 nm, Emission Start Wavelength: 500 nm and Emission End wavelength: 680 nm. If one uses the same cuvettes, they should be first washed with the solvent and then rinsed with the experimental solutions prior to filling up the cuvette with the solution for measurements.
- Click on 'Reset' button to start over the measurements.
- Collect all data by clicking on the Data tab.
- Calculate the integrated fluorescence intensity from the fluorescence spectrum (i.e., determine the area under the two emission spectral curves).
- Determine the quantum yield of rhodamine B (Given: ΦF of rhodamine 6G = 0.95).
- Compare your experimentally determined quantum yield of rhodamine B with the literature value (ΦF= 0.70).