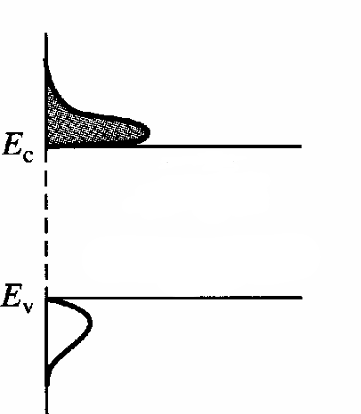
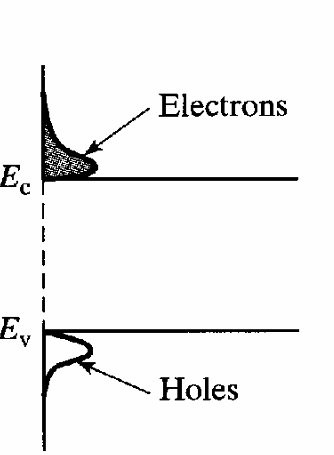
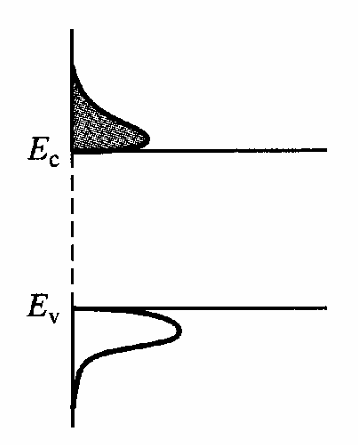
The following three plots are those of carrier distribution vs Energy.
The fermi level of each of these plots is either near the midgap, below midgap or above midgap.
Match the plots to what type of dopants are present in each semiconductor
Match the plots by clicking on the images first anf then their label
Once a line is drawn you cannot match either the diagram or label to another label or diagram. To undo your answers, please click on the refresh button.