Manual
1. Prepare five calibration standards for each analyte:
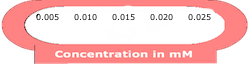
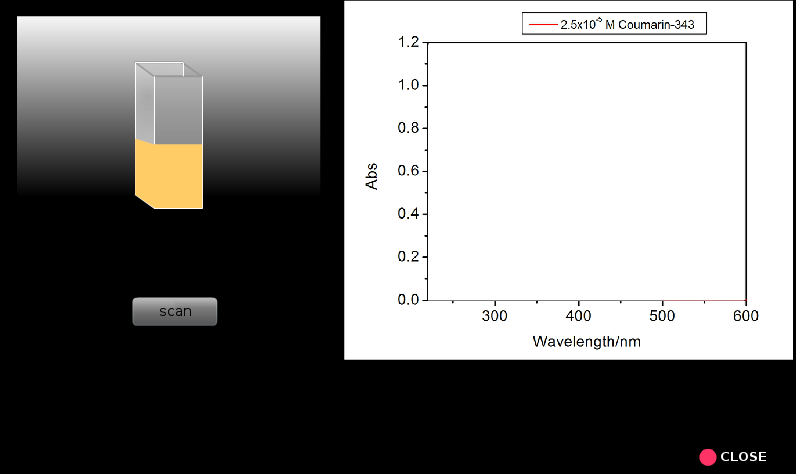
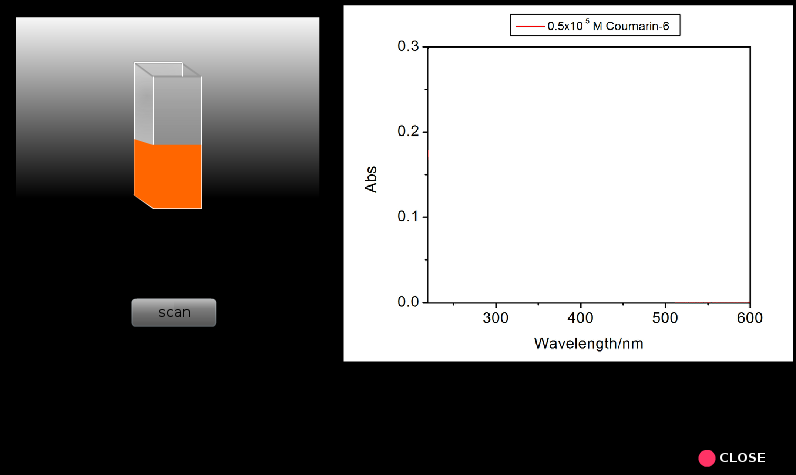
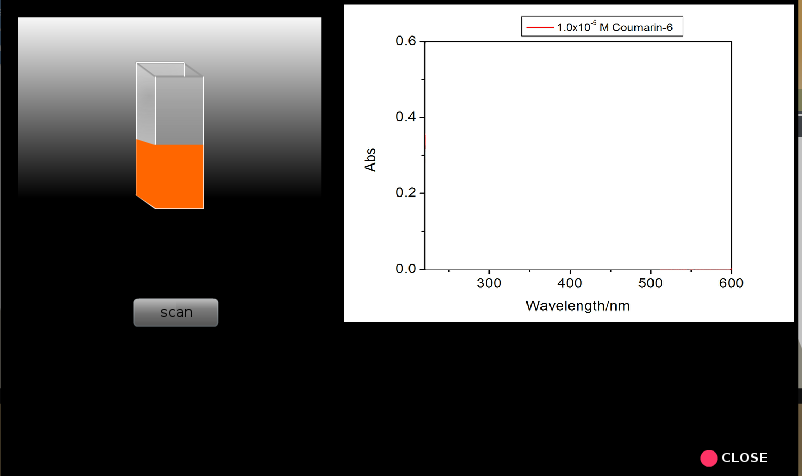
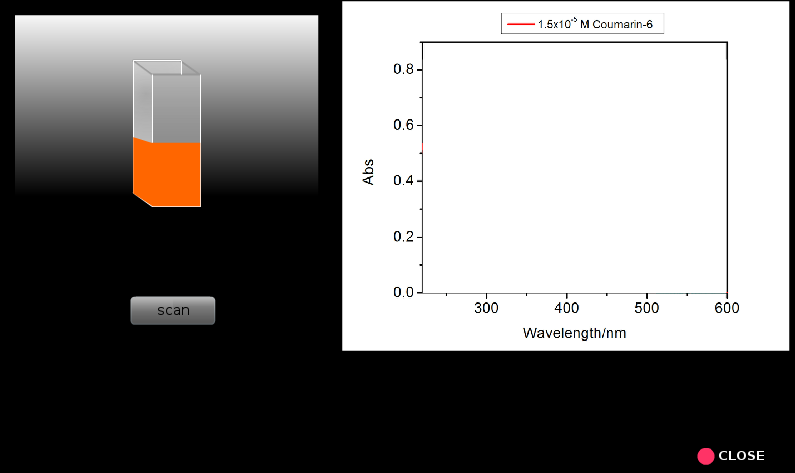
0.025 mM, 0.020 mM, 0.015 mM, 0.010 mM, and 0.005 mM coumarin 343 solutions and 0.020mM, 0.015 mM, 0.01 mM, 0.005 mM and 0.0025mM coumarin 6 solutions in ethanol.
Also prepared a solution containg 1:1 (v/v) mixture of 0.025mM coumarin 343 and 0.020 mM coumarin 6.
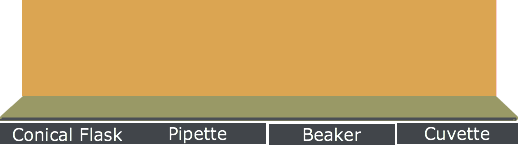
The solutions to be analyzed are selcted from the drop-down menu. The solution concentrations are selected from the concentration scale bars.
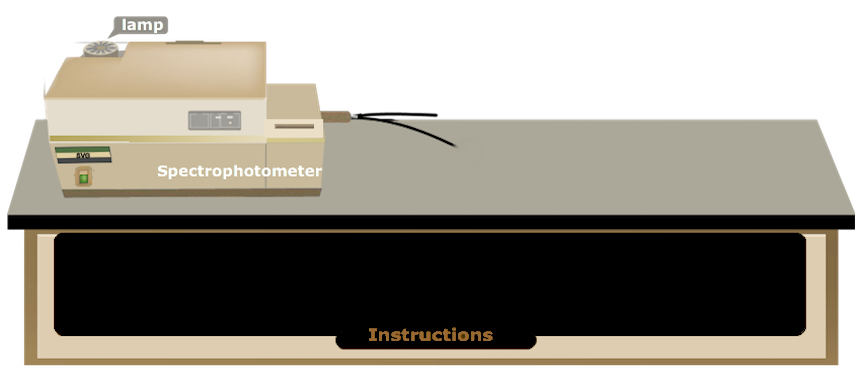
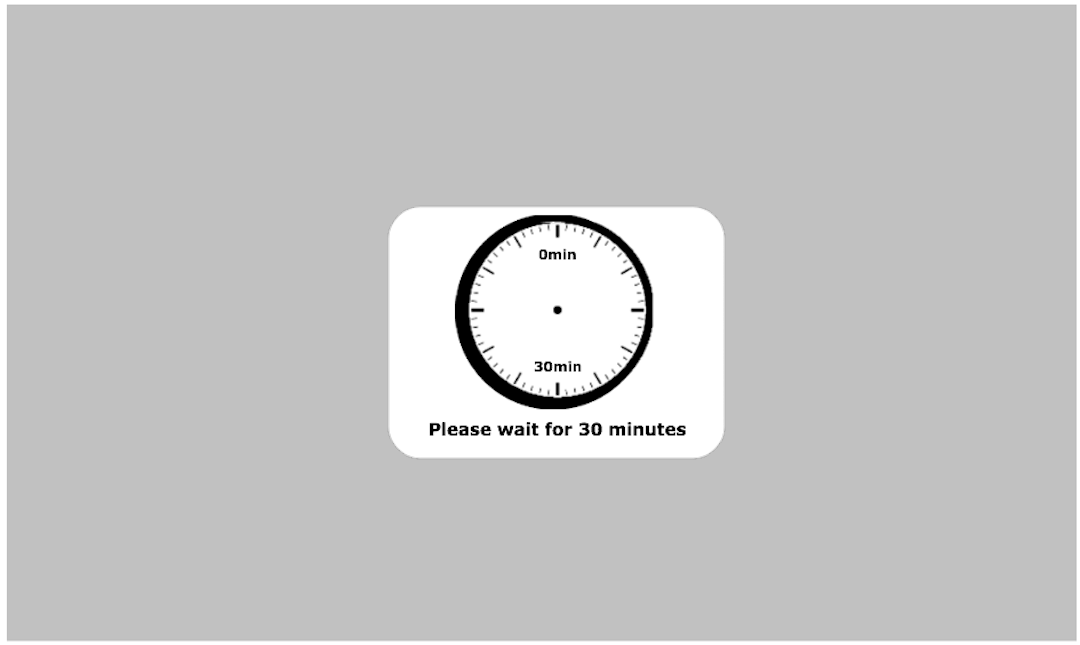
2. Switch on the computer and the instrument powers; wait for 30mins for 'warm-up' of the instrument.
3. In the instrument one can select light sources (UV and visible), choose the slit width, scan speed and %trasmittance or absorbance display, wavelength range of interest, etc.
4. Take two clean and dry quartx curvettes with a given path length(here we used 1 cm path length curvette).
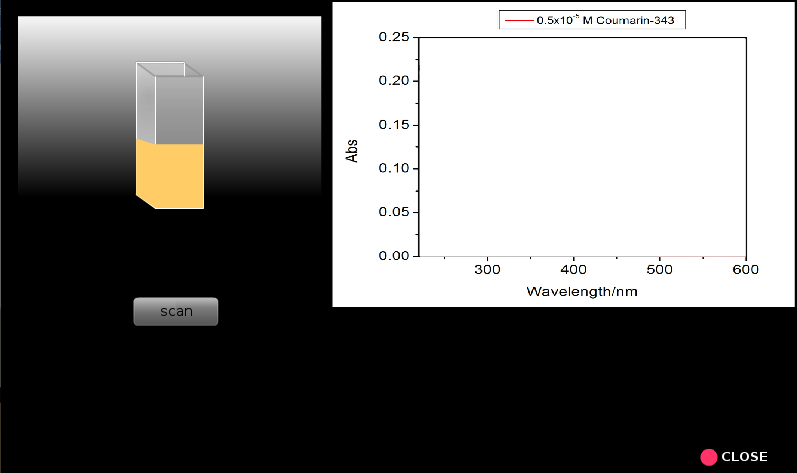
5. Fill up one curvete with sample blank (ethanol in the present case) and the other curvette with the lowest concentration coumsrin 343 solution.
6. Place the sample blank in the reference holder and the sample in the sample holder.
7. Run the scan ( A versus lambda).
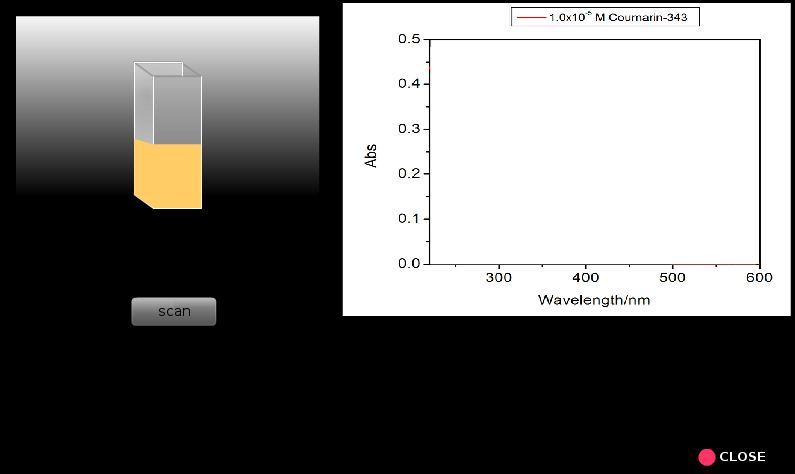
8. Similarly run spectral scans for all the other samples proceeding from lower concentrations to higher concentrations. Everytime one should rinse the cuvette taking a small portion of the solution from the solution that will be analzed.
9. Repeat steps 5 to 8 for coumarin 6 solutions.
10. Run the scan for the multiple-component solution (mixture) sample, containing both coumarin 343 and coumarin 6 solutions.
11. Determine the wavelengths of maximum absorbance (lambda_max) for both coumarin 343 and coumarin 6. Now find out the wavelengths, the absorbance at a given lambda_max for all the solutions and prepare a table containing these data.
12. Determine the absorbance values 0f 2.5*10. - pending
13. For any lambda_max, calculate the sum of absorbance values of individual components in the mixture from the relation: AX+Y = (AX0/CX0).CX + (AY0)/CY0).CY(see eq 4).
14. Compare the above sum with the measured absorbance value of the mixture = Amix for the same max.
15. Check Amix= AX+Y realtionship for another lambda_max.
16. Construct calibration plots by plotting absorbance versus concentration for two wavelengths (say, lambda=420nm and 463 nm) for both coumarin 343 and coumarin 6 solutions. Determine the slopes of the calibration plots and hence the respective values of lambda's for two different wavelengths for coumarin 343 and coumarin 6.
17. Determine the absorbance values of 1:1 mixture sample at the above two wavelengths.
18. Using the values of mixture absorbance and lambda, determine the concentration of the both coumarin 343 and coumarin 6 in the mixture by solving the Beer Lambert law for the two component system.
19. Calculate the actual concentrations of coumarin 343 and coumarin 6 in the mixture from their original concentrations and volumes taken for making the mixture.
20. Compare the concentration values determined from the absorbance measurements with the concentration values calculated from the actual concentrations taken to prepare the mixture to verify the validity of the principle of the additivity of absorbance values.
21. Do a multi-peak fitting of the spectrum obtained from the solution containing both coumarin 343 and coumarin 6.
22. Discuss your results.